06Jun

Sei / U.S. Dollar SEIUSD Elliott Wave Analysis: Identifying Breakout Opportunities and Strategic Entry Points for Effective Crypto Trading

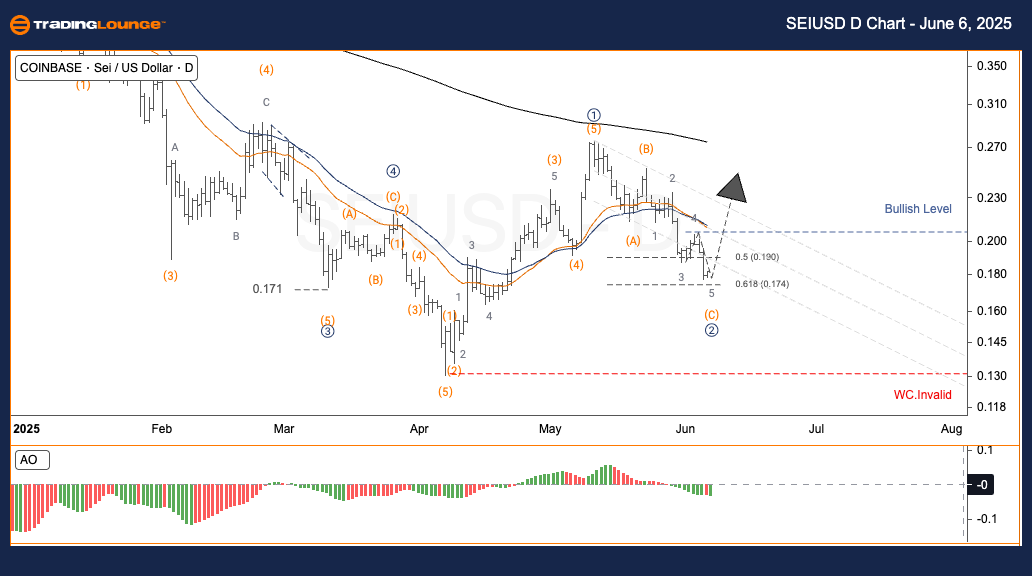
SEIUSD Elliott Wave Analysis – TradingLounge Daily Chart

SEI / U.S. Dollar (SEIUSD) Daily Chart Analysis

SEIUSD Elliott Wave Technical Overview

Function: Continuation of Uptrend

Wave Mode: Motive Phase

Pattern Type: Impulse Formation

Wave Status: Currently in Wave 2

Higher Degree Trend: Yet to Confirm

Critical Invalidation Level: Breakdown below $0.130

SEI/USD Strategy Overview – Daily Timeframe

SEI/USD has completed a distinct 5-wave advance, finalizing wave ① near the $0.32 mark. The asset is now retracing through a Zigzag (A–B–C) correction, signaling that wave ② is nearing its conclusion at a key Fibonacci support region.

Recommended Strategy

For Swing Traders (Short-Term Focus)
✅ Trade Setup:
Watch for a confirmed breakout above $0.220 to validate the beginning of wave ③. If confirmed, initiate trades in sync with the primary bullish structure.

Risk Control Parameters

🟥 Wave Count Invalidity: A sustained move below $0.130 will invalidate the current Elliott structure.

SEIUSD-day-Crypto-ch...


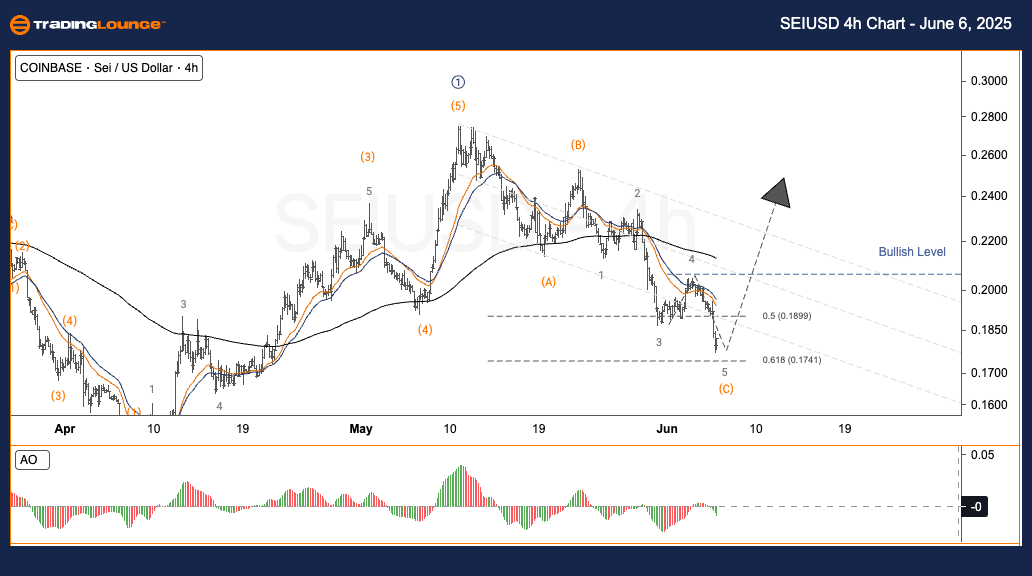
SEIUSD Elliott Wave Analysis – TradingLounge 4-Hour Chart

SEI / U.S. Dollar (SEIUSD) 4-Hour Chart Analysis

SEIUSD Elliott Wave Technical Overview

Function: Continuation of Trend

Wave Mode: Motive Phase

Pattern Type: Impulse Setup

Wave Status: In Wave 2 Development

Higher Degree Direction: Pending Confirmation

Key Invalidation Level: Price breach under $0.130

SEI/USD Strategy Summary – 4H Timeframe

After reaching wave ① around the $0.32 zone, SEI/USD is correcting within an A–B–C Zigzag structure, forming wave ②. The retracement appears to be stabilizing near Fibonacci-based support.

Recommended Strategy

For Swing Traders (Short-Term Traders)

✅ Entry Signal: A decisive break above $0.220 would suggest the onset of wave ③. Traders should consider long entries aligned with the prevailing bullish momentum.

Risk Control Parameters

🟥 Invalidation Marker: Any drop below $0.130 nullifies the present wave scenario.

Technical Analyst: Malik Awais

Source: Visit Tradinglounge.com and learn from the Experts. Join TradingLounge Here

Previous: DOTUSD Elliott Wave Technical Analysis

VALUE Offer - Buy 1 Month & Get 3 Months!Click here

Access 7 Analysts Over 200 Markets Covered. Chat Room With Support

SEIUSD-4h-Crypto-cha...

Related

Unlocking ASX Trading Success: SCENTRE GROUP (SCG) Stock Analysis & Elliott Wave Technical Forecast

Unlocking ASX Trading Success: SCENTRE GROUP (SCG) Stock Analysis & Elliott Wave Technical Forecast

Get comprehensive insights into SCENTRE GROUP (SCG) stock on the ASX with our Elliott Wave analysis....

Read More >
Costco Wholesale Corp.(COST:NASDAQ) Elliott Wave Technical Analysis 14 November 23

Costco Wholesale Corp.(COST:NASDAQ) Elliott Wave Technical Analysis 14 November 23

Costco Wholesale Corp.(COST:NASDAQ) Elliott Wave Technical Analysis on 14 November 23 with 1-Hour an...

Read More >
Polkadot Elliott Wave Technical Forecast: DOT Crypto Price Set for Reversal as Wave 2 Nears Completion with Strong Wave 3 Ahead

Polkadot Elliott Wave Technical Forecast: DOT Crypto Price Set for Reversal as Wave 2 Nears Completion with Strong Wave 3 Ahead

Polkadot (DOT) is in a wave 2 correction phase, with potential bullish reversal near $3.62–$3.94. E...

Read More >
Market Structure And Future movements of Walmart Inc. Stocks with WMT Elliott Wave Technical Analysis

Market Structure And Future movements of Walmart Inc. Stocks with WMT Elliott Wave Technical Analysis

This comprehensive analysis of Walmart Inc. (WMT) uses the Elliott Wave theory to provide insights i...

Read More >
Euro Stoxx 50 Elliott Wave Analysis: Bullish Trend Forecast, Trading Strategy, Key Levels, and Daily Market Outlook for Investors

Euro Stoxx 50 Elliott Wave Analysis: Bullish Trend Forecast, Trading Strategy, Key Levels, and Daily Market Outlook for Investors

The Euro Stoxx 50 shows a strong bullish trend supported by Elliott Wave analysis. Traders should wa...

Read More >
IBEX 35 (Spain) Index Elliott Wave Technical Analysis: Stay Ahead with the Latest Market Trends and Forecasts

IBEX 35 (Spain) Index Elliott Wave Technical Analysis: Stay Ahead with the Latest Market Trends and Forecasts

This article provides a comprehensive IBEX 35 Elliott Wave Analysis, focusing on Spain's stock m...

Read More >

$1 for 2 Weeks

then $29 a month!

What a Special Offer!

Trade Recommendations

Unleash the power of deversified trading with our comprehensive portfolio, covering 250+ markets:

  • Stock Trades
  • Crypto Trades
  • Forex Trades
  • Commodity Trades
Elliott Wave Analysis

Gain a competitive edge with expert insights and AI-powered Elliott Wave charting into:

  • Global Indices
  • US Stocks & ASX Stocks
  • Forex & Crypto
  • Commodities
Top-Notch Trading Tools

Equip yourself with the tools of success:

  • Real-time Chat rooms
  • Elliott Wave Algorithm
  • Portfolio tools
  • TradingLevels
  • Screener
  • Trading Game
7 Elliott Wave Analysts

Stay ahead of the market with daily charts and insightful videos
Your secret to strategic trading!

JOIN HERE


Welcome to TradingLounge (ASIC A.R.No. 321187), specialists in trades, trading education and technical analysis, covering stocks, indices, commodities, forex and cryptocurrencies.

When you join TradingLounge you have access to everything we offer, including trade tools, educational content and a social platform to chat with like-minded investors.

Read more

@Copyright 2024 by tradinglounge.com

Contact Us

Australian no: 02 4787 6020

International no: +61 (2) 47876020

Pay with:

Find us on