04Dec

NIFTY 50 (India) Elliott Wave Technical Analysis: Insights into Corrective Waves, Invalidation Levels, and Key Market Trends for Traders

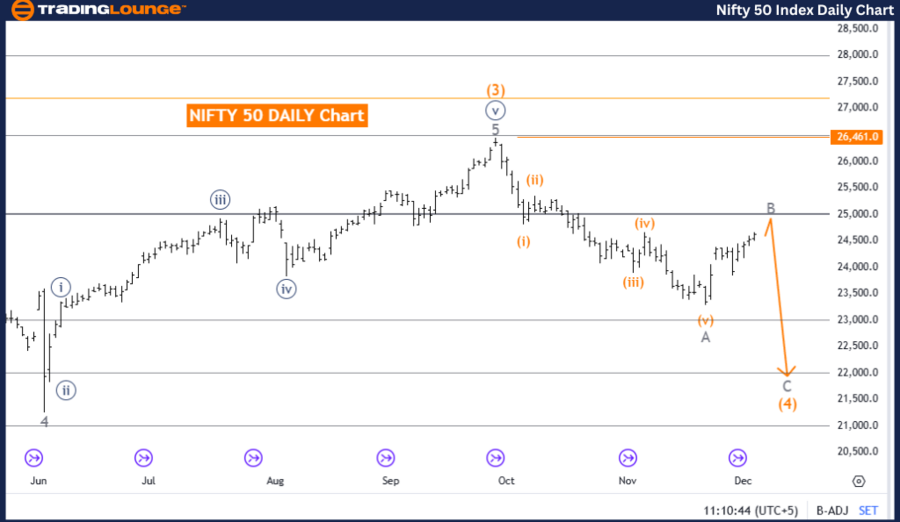
NIFTY 50 (India) Elliott Wave Analysis Trading Lounge Day Chart

NIFTY 50 (India) Elliott Wave Technical Analysis

Function: Counter Trend

Mode: Corrective

Structure: Gray Wave B

Position: Orange Wave 4

Direction Next Lower Degrees: Gray Wave C

Details: Gray Wave A of 4 appears to have completed; Gray Wave B of 4 is now active.

Wave Cancel Invalidation Level: 26,461.0

The NIFTY 50 daily chart demonstrates an Elliott Wave analysis highlighting a counter-trend phase. The ongoing wave structure is defined as Gray Wave B, part of a corrective pattern within Orange Wave 4. As per the current analysis, Gray Wave A of 4 seems to have completed, and the market has now progressed into Gray Wave B of 4.

This corrective wave represents a temporary pause or reversal in the broader trend, aligning with the principles of Elliott Wave Theory. The next expected development is Gray Wave C, which would finalize the corrective sequence within Orange Wave 4.

An invalidation level for this wave count is established at 26,461.0. Should the market fall below this level, the wave structure would require reassessment, suggesting a possible divergence from the expected trajectory.

This technical analysis provides traders with a structured outlook on the ongoing corrective phase. It highlights essential levels and directional trends, delivering insights into potential price movements within the current counter-trend framework.

NIFTY-50-index-daily...


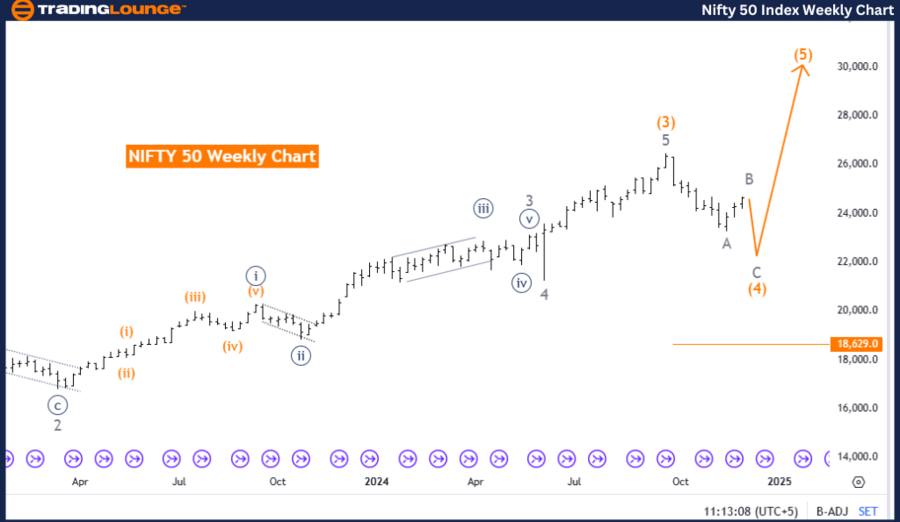
NIFTY 50 (India) Elliott Wave Analysis Trading Lounge Weekly Chart

NIFTY 50 (India) Elliott Wave Technical Analysis

Function: Counter Trend

Mode: Corrective

Structure: Orange Wave 4

Direction Next Higher Degrees: Orange Wave 5

Details: Orange Wave 3 appears to have completed; Orange Wave 4 is now active.

Wave Cancel Invalidation Level: 18,629.0

The NIFTY 50 weekly chart reveals an Elliott Wave analysis pointing toward a counter-trend phase. The current wave structure is identified as Orange Wave 4, a corrective phase following the completion of Orange Wave 3. This indicates a period of consolidation or retracement before the larger bullish trend resumes.

The ongoing phase of Orange Wave 4 is expected to lead into the formation of Orange Wave 5 once the corrective structure concludes. This progression aligns with the foundational principles of Elliott Wave Theory, which describes corrective waves as brief interruptions in an overarching trend.

An invalidation level for this wave count is set at 18,629.0. If the market exceeds this threshold, the wave structure will need to be revisited, signaling a potential deviation from the anticipated pattern.

This analysis offers traders a well-defined understanding of the corrective phase currently underway. By highlighting critical levels and expected directional movements, it equips traders with actionable insights for navigating the transition toward the forthcoming bullish phase marked by Orange Wave 5.

Technical Analyst: Malik Awais

Source: visit Tradinglounge.com and learn From the Experts Join TradingLounge Here 

Previous: NIKKEI 225 (N225) Elliott Wave Technical Analysis  

VALUE Offer - Buy 1 Month & Get 3 Months!Click here

Access 7 Analysts Over 200 Markets Covered. Chat Room With Support

NIFTY-50-index-weekl...

Related

WTI Elliott Wave Analysis Revealing Crude Oil Price Trends, Key Support Levels, Bearish Breakouts, and Technical Outlook

WTI Elliott Wave Analysis Revealing Crude Oil Price Trends, Key Support Levels, Bearish Breakouts, and Technical Outlook

This analysis delves into WTI crude oil price movements using Elliott Wave theory. It highlights the...

Read More >
Bharat Electronics Ltd (BEL) Elliott Wave Stock Analysis: Price Targets, Support & Resistance Levels, and daily and 4H chart insights

Bharat Electronics Ltd (BEL) Elliott Wave Stock Analysis: Price Targets, Support & Resistance Levels, and daily and 4H chart insights

Bharat Electronics Ltd (BEL) Elliott Wave technical analysis, highlighting daily and 4H chart insigh...

Read More >
Unlock the Future of Brambles Limited Stock with Expert BXB Elliott Wave Analysis: ASX Stock Forecast Revealed

Unlock the Future of Brambles Limited Stock with Expert BXB Elliott Wave Analysis: ASX Stock Forecast Revealed

This detailed analysis of Brambles Limited (BXB) on the Australian Stock Exchange (ASX) provides ins...

Read More >
Euro/U.S. Dollar (EURUSD) Elliott Wave Forecast: Orange Wave 5 Impulse with Gray Wave 2 Correction & 1.10651 Invalidation Key

Euro/U.S. Dollar (EURUSD) Elliott Wave Forecast: Orange Wave 5 Impulse with Gray Wave 2 Correction & 1.10651 Invalidation Key

Elliott Wave breakdown for EURUSD: Daily chart shows impulsive Orange Wave 5 within Navy Blue Wave 1...

Read More >
British Pound/Japanese Yen(GBPJPY)  Forex Elliott Wave Technical Analysis: Technical levels and future market directions

British Pound/Japanese Yen(GBPJPY)  Forex Elliott Wave Technical Analysis: Technical levels and future market directions

This detailed analysis of GBPJPY using the Elliott Wave theory offers a deep dive into the correctiv...

Read More >
Gain expert insights into Dogecoin's market Crypto Price: DOGEUSD Elliott Wave Technical Analysis

Gain expert insights into Dogecoin's market Crypto Price: DOGEUSD Elliott Wave Technical Analysis

trends with our comprehensive Elliott Wave analysis. Learn about DOGEUSD technical analysis, trading...

Read More >

$1 for 2 Weeks

then $29 a month!

What a Special Offer!

Trade Recommendations

Unleash the power of deversified trading with our comprehensive portfolio, covering 250+ markets:

  • Stock Trades
  • Crypto Trades
  • Forex Trades
  • Commodity Trades
Elliott Wave Analysis

Gain a competitive edge with expert insights and AI-powered Elliott Wave charting into:

  • Global Indices
  • US Stocks & ASX Stocks
  • Forex & Crypto
  • Commodities
Top-Notch Trading Tools

Equip yourself with the tools of success:

  • Real-time Chat rooms
  • Elliott Wave Algorithm
  • Portfolio tools
  • TradingLevels
  • Screener
  • Trading Game
7 Elliott Wave Analysts

Stay ahead of the market with daily charts and insightful videos
Your secret to strategic trading!

JOIN HERE


Welcome to TradingLounge (ASIC A.R.No. 321187), specialists in trades, trading education and technical analysis, covering stocks, indices, commodities, forex and cryptocurrencies.

When you join TradingLounge you have access to everything we offer, including trade tools, educational content and a social platform to chat with like-minded investors.

Read more

@Copyright 2024 by tradinglounge.com

Contact Us

Australian no: 02 4787 6020

International no: +61 (2) 47876020

Pay with:

Find us on