PANW Elliott Wave Analysis: Evaluating Current Wave Structure for Potential Price Movements

This Elliott Wave analysis for Palo Alto Networks Inc. (PANW) provides an in-depth look at the wave structure and potential price action on both the daily and 1-hour charts. The focus is on identifying wave positions and key price levels that could inform trading strategies.

PANW Elliott Wave Analysis - TradingLounge Daily Chart

Palo Alto Networks Inc. (PANW) Daily Chart Analysis

PANW Elliott Wave Technical Analysis

Function: Trend

Mode: Impulsive

Structure: Motive

Position: Minor 1 of (5)

Direction: Upside into wave 1

Details: The daily chart suggests that PANW is resuming its uptrend following a three-wave move into wave (4). The stock is currently trading between TradingLevel3 (TL3) and the $400 price level, indicating a potential breakout to the upside in Minor wave 1 of Intermediate wave (5).

PANW Stock Technical Analysis – Daily Chart

PANW has completed a corrective three-wave structure into wave (4), positioning it for an impulsive move higher. The stock is currently trading between TL3 and $400, suggesting that the next key level to watch is a breakout above $400, which would confirm the continuation of the uptrend in Minor wave 1 of Intermediate wave (5). Traders should monitor for this breakout as it signals further upside potential.

PaloAlto-Networks-In...


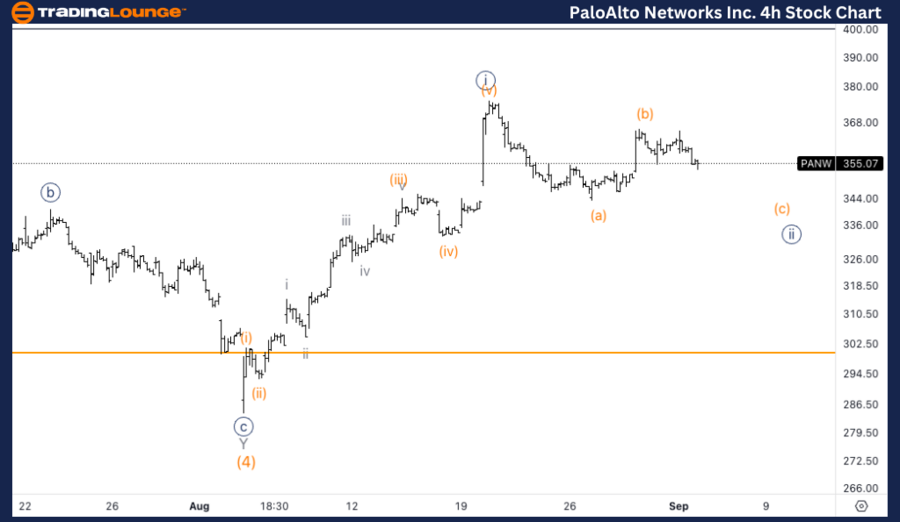
PANW Elliott Wave Analysis - TradingLounge 1H Chart

Palo Alto Networks Inc. (PANW) 1H Chart Analysis

PANW Elliott Wave Technical Analysis

Function: Trend

Mode: Impulsive

Structure: Motive

Position: Wave {ii} of 1

Direction: Bottom in wave {ii}

Details: The 1-hour chart indicates that PANW is in a corrective phase, specifically in wave {ii} of 1. The stock may either continue sideways in wave (b) of {ii} before completing the correction lower in wave (c), or wave (c) may already be in progress.

PANW Elliott Wave Technical Analysis – 1H Chart

The current corrective phase in wave {ii} of 1 could unfold in one of two scenarios: a sideways move in wave (b) of {ii}, followed by a lower move in wave (c), or wave (c) is already underway. Once wave {ii} completes, traders should anticipate a continuation of the uptrend in wave {iii} of 1, signaling a potential buying opportunity.

Technical Analyst: Alessio Barretta

Source: visit Tradinglounge.com and learn From the Experts Join TradingLounge Here 

See Previous: Costco Wholesale Corp. (COST) Elliott Wave Technical Analysis

Special Trial Offer - 0.76 Cents a Day for 3 Months! Click here

Access 7 Analysts Over 200 Markets Covered. Chat Room With Support

PaloAlto-Networks-In...

Related

NEO Crypto Market with our Expert Analysis and Advanced NEOUSD Elliott Wave Technical Analysis

NEO Crypto Market with our Expert Analysis and Advanced NEOUSD Elliott Wave Technical Analysis

Gain an in-depth understanding of NEOUSD through Elliott Wave analysis. Our detailed guide covers NE...

Read More >
The TJX Companies Inc.Elliott Wave Technical Analysis: Insight into Trading Opportunities

The TJX Companies Inc.Elliott Wave Technical Analysis: Insight into Trading Opportunities

TJX's Elliott Wave analysis offers strategic perspectives for traders. Explore trading opportuni...

Read More >
Unlocking ASX Trading Success: Goodman Group – GMG Stock Analysis & Elliott Wave Technical Forecast

Unlocking ASX Trading Success: Goodman Group – GMG Stock Analysis & Elliott Wave Technical Forecast

This article provides a comprehensive Elliott Wave analysis of the ASX-listed Goodman Group (GMG). I...

Read More >
Trust Amplify Junior Silver Miners ETF - SILJ Elliott Wave Technical Analysis Shows Bullish Wave 3 Setup with Strong Rally

Trust Amplify Junior Silver Miners ETF - SILJ Elliott Wave Technical Analysis Shows Bullish Wave 3 Setup with Strong Rally

SILJ ETF is forming a strong Elliott Wave rally setup. Wave (ii) correction nears completion, with a...

Read More >
Commodity Market Elliott Wave Analysis: Bitcoin, Ethereum, Gold, Silver, Crude Oil, and More

Commodity Market Elliott Wave Analysis: Bitcoin, Ethereum, Gold, Silver, Crude Oil, and More

Get the latest Commodity Market Elliott Wave Analysis for Bitcoin, Ethereum, GBTC, TLT Bonds, US 10 ...

Read More >
Unlocking ASX Trading Success: NEWMONT CORPORATION – NEM Stock Analysis & Elliott Wave Technical Forecast

Unlocking ASX Trading Success: NEWMONT CORPORATION – NEM Stock Analysis & Elliott Wave Technical Forecast

Dive into our comprehensive Elliott Wave analysis for NEWMONT CORPORATION (NEM) on the Australian St...

Read More >

$1 for 2 Weeks

then $29 a month!

What a Special Offer!

Trade Recommendations

Unleash the power of deversified trading with our comprehensive portfolio, covering 250+ markets:

  • Stock Trades
  • Crypto Trades
  • Forex Trades
  • Commodity Trades
Elliott Wave Analysis

Gain a competitive edge with expert insights and AI-powered Elliott Wave charting into:

  • Global Indices
  • US Stocks & ASX Stocks
  • Forex & Crypto
  • Commodities
Top-Notch Trading Tools

Equip yourself with the tools of success:

  • Real-time Chat rooms
  • Elliott Wave Algorithm
  • Portfolio tools
  • TradingLevels
  • Screener
  • Trading Game
7 Elliott Wave Analysts

Stay ahead of the market with daily charts and insightful videos
Your secret to strategic trading!

JOIN HERE


Welcome to TradingLounge (ASIC A.R.No. 321187), specialists in trades, trading education and technical analysis, covering stocks, indices, commodities, forex and cryptocurrencies.

When you join TradingLounge you have access to everything we offer, including trade tools, educational content and a social platform to chat with like-minded investors.

Read more

@Copyright 2024 by tradinglounge.com

Contact Us

Australian no: 02 4787 6020

International no: +61 (2) 47876020

Pay with:

Find us on