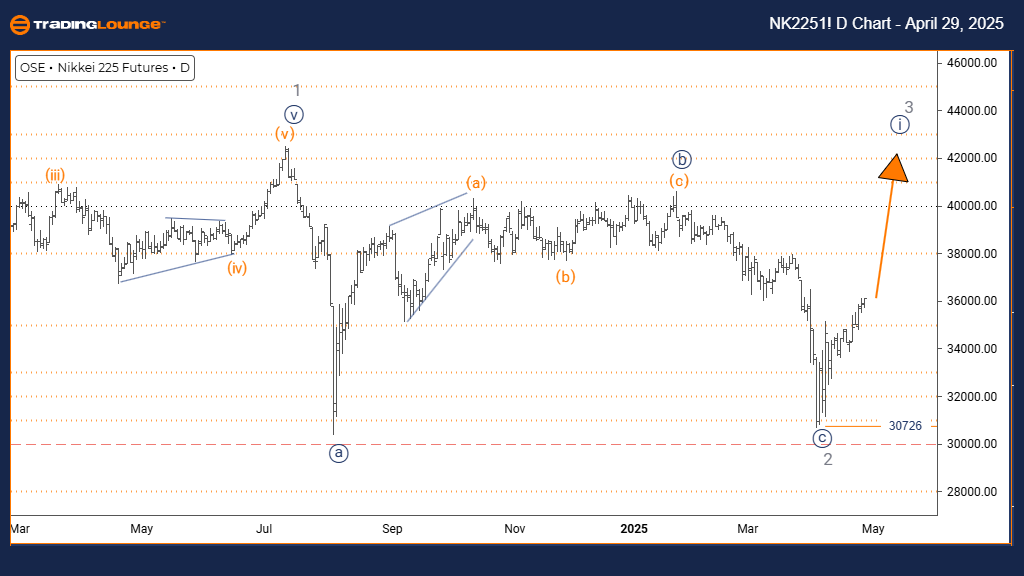
NIKKEI 225 (N225) – Elliott Wave Analysis | TradingLounge Daily Chart
NIKKEI 225 (N225) Wave Count & Technical Forecast
NIKKEI 225 (N225) Elliott Wave Technical Analysis
Market Function: Bullish Trend
Wave Mode: Impulsive
Wave Structure: Navy Blue Wave 1
Wave Position: Gray Wave 3
Next Higher Degree Projection: Navy Blue Wave 1 in progress
Analysis Detail: Gray wave 2 is likely complete; navy blue wave 1 of 3 is now unfolding
Invalidation Level: 30,726
The NIKKEI 225 Elliott Wave daily analysis signals the start of a bullish impulsive wave sequence. Following the completion of corrective gray wave 2, the index is now progressing into navy blue wave 1 within a broader gray wave 3 framework. This transition suggests the beginning of a new upward impulse with growth potential.
Wave 1 (navy blue) initiates this bullish leg, often characterized by a building but measured rise in price. As gray wave 2 ends, it sets a technical foundation for wave 1's advance, indicating improving sentiment and a steady upward shift. This early phase typically lacks aggression but reflects a shift toward bullish positioning.
The critical invalidation threshold remains at 30,726. A break below this point would negate the current bullish count, triggering a need for reanalysis. Until then, this level acts as key structural support protecting the base of wave 2.
Daily wave structure insights indicate the early stage of a broader impulsive trend. Traders should monitor volume expansion and price stability as signs of a developing bullish phase. Wave 1 often progresses more slowly, with stronger acceleration typically emerging in wave 3.
Looking ahead, a corrective pullback in the form of navy blue wave 2 is anticipated after wave 1 completes. This will likely provide a buying opportunity before a more aggressive push occurs in wave 3. Tracking price momentum and indicator signals can aid in validating the wave count and capturing the transition.
Technical confirmation of this wave count remains critical. With gray wave 3 underway, traders should prepare for increasing upward pressure as the broader trend builds. This stage is ideal for accumulating long positions aligned with Elliott Wave principles.
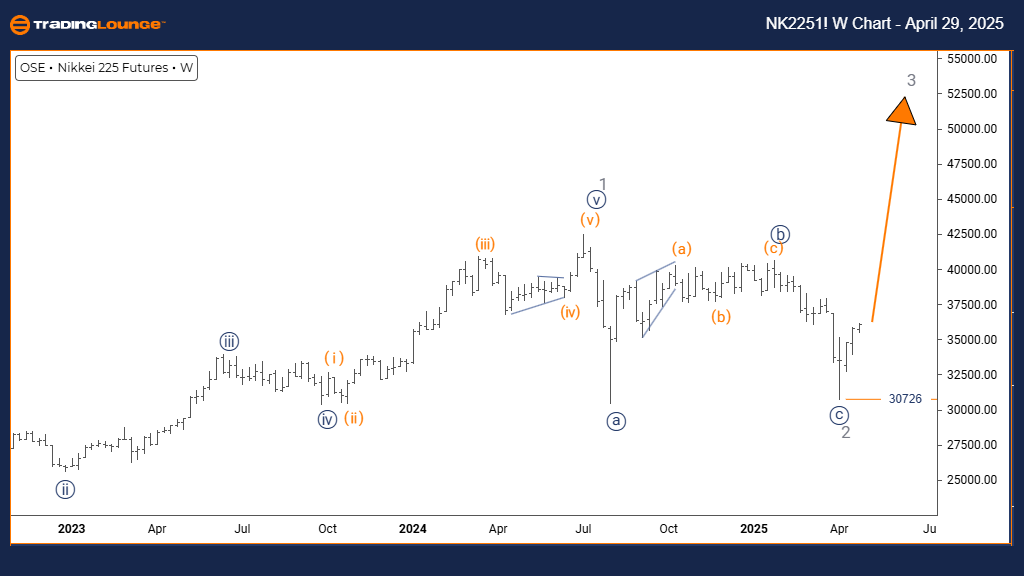
NIKKEI 225 (N225) – Elliott Wave Analysis | TradingLounge Weekly Chart
NIKKEI 225 (N225) Wave Count & Long-Term Forecast
Market Function: Bullish Trend
Wave Mode: Impulsive
Wave Structure: Gray Wave 3
Wave Position: Orange Wave 3
Next Higher Degree Projection: Gray Wave 3 in progress
Analysis Detail: Gray wave 2 is confirmed complete; gray wave 3 of 3 is now active
Invalidation Level: 30,726
The NIKKEI 225 weekly Elliott Wave forecast highlights a strong bullish impulsive wave formation. With gray wave 2 now complete, the index is moving firmly into gray wave 3 within the larger orange wave 3 cycle—typically the most dynamic and powerful stage of an Elliott Wave advance.
Wave 3 represents the core trend segment in impulsive structures, often generating strong momentum and significant price appreciation. The completion of gray wave 2 provides technical confirmation for the beginning of this larger rally. Historically, wave 3 movements tend to exceed the reach of wave 1, offering high potential for price expansion.
Key support remains at 30,726. Should the market breach this level, the current wave structure would be invalidated, calling for a revised Elliott Wave interpretation.
Weekly chart patterns support the outlook of a long-term bullish trend unfolding. The development of gray wave 3 under the larger orange wave 3 umbrella points to a sustained rally, possibly extending over months. Traders should seek evidence of rising momentum, expanding volume, and strong directional bias to confirm wave 3's integrity.
Following the completion of gray wave 3, a corrective phase in gray wave 4 is expected. This pullback could offer a strategic entry opportunity before the final leg of the uptrend resumes.
This phase—gray wave 3—typically delivers some of the most tradable price action in Elliott Wave sequences. It combines trend strength with growing market confidence, providing favorable conditions for bullish setups and position building.
Technical Analyst: Malik Awais
Source: Visit Tradinglounge.com and learn from the Experts. Join TradingLounge Here
Previous: NASDAQ Index Elliott Wave Technical Analysis
VALUE Offer - Buy 1 Month & Get 3 Months!Click here
Access 7 Analysts Over 200 Markets Covered. Chat Room With Support