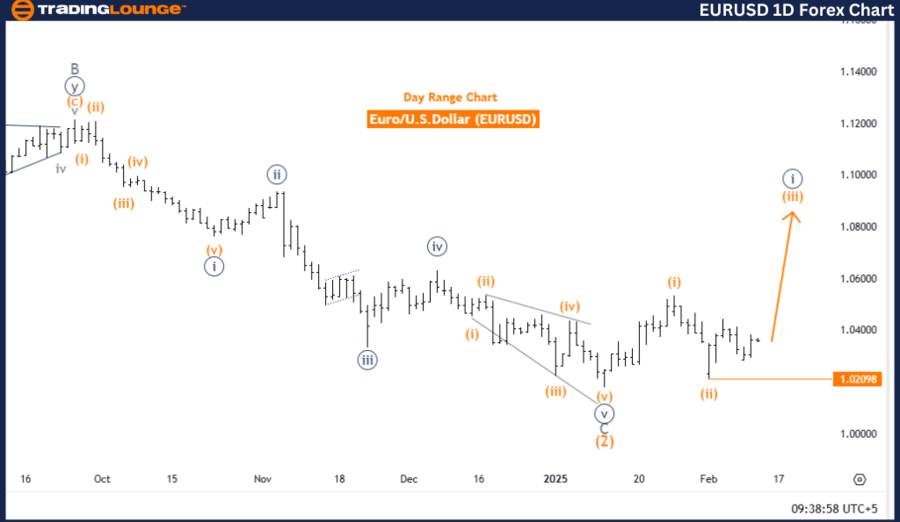
Euro/U.S. Dollar (EURUSD) Day Chart – Elliott Wave Technical Analysis
EURUSD Elliott Wave Forecast
Function: Bullish Trend
Mode: Impulsive
Structure: Orange Wave 3
Position: Navy Blue Wave 3
Next Higher Degree Direction: Orange Wave 3 (Initiated)
Details: Orange Wave 2 of 3 appears completed, with Orange Wave 3 now in play.
Wave Invalidation Level: 1.02098
Market Overview
The EURUSD daily chart confirms a strong bullish trend, supported by an impulsive Elliott Wave structure. The current wave in focus, Orange Wave 3, forms part of a broader Navy Blue Wave 3, reinforcing upward market strength.
Following the completion of Orange Wave 2, a corrective phase, Orange Wave 3 has commenced, marking the beginning of a high-momentum bullish movement. Historically, this wave phase is associated with accelerated price gains, highlighting the market’s bullish sentiment.
The presence of Navy Blue Wave 3 further supports a positive market outlook, indicating continued upward movement. As long as Orange Wave 3 progresses, traders can expect rapid price increases, characteristic of this wave phase.
Key Level to Monitor
A significant level to watch is the wave invalidation level at 1.02098. If the price falls below this point, the current wave count becomes invalid. However, as long as EURUSD remains above this level, the bullish trend remains intact, affirming the continuation of the impulsive wave pattern.
Conclusion
The EURUSD daily chart signals a bullish trend, with Orange Wave 3 actively developing within Navy Blue Wave 3. The market is expected to maintain its upward trajectory, confirming bullish dominance.
Traders should monitor price action above 1.02098 to validate trend strength and adjust their trading strategies accordingly.
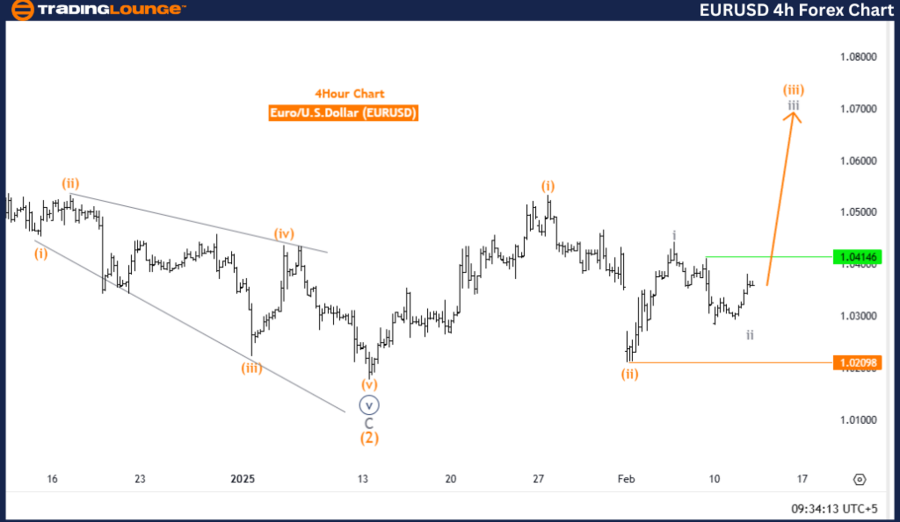
Euro/U.S. Dollar (EURUSD) 4-Hour Chart – Elliott Wave Technical Analysis
EURUSD Elliott Wave Forecast
Function: Bullish Trend
Mode: Impulsive
Structure: Gray Wave 3
Position: Orange Wave 3
Next Higher Degree Direction: Gray Wave 3 (Initiated)
Details: Gray Wave 2 of Orange Wave 3 appears completed, with Gray Wave 3 now in play.
Wave Invalidation Level: 1.02098
Market Overview
The EURUSD 4-hour chart reinforces a bullish market outlook, confirmed by an impulsive Elliott Wave pattern. The current wave position within Orange Wave 3, which forms part of a larger Gray Wave 3, indicates a continuation of strong upward momentum.
With Gray Wave 2 completing its corrective phase, the market has transitioned into Gray Wave 3 of Orange Wave 3. This key impulsive phase typically marks sharp price gains, underscoring the strength of the ongoing bullish trend.
Key Factors to Monitor
As Gray Wave 3 unfolds, traders should anticipate further bullish movement, with potential price rallies. This wave phase is often characterized by strong upward momentum, presenting high-probability trading opportunities.
A critical level to watch is the wave invalidation point at 1.02098. If breached, this would invalidate the current wave count, necessitating a reassessment of market structure. However, as long as EURUSD remains above this level, the bullish trend remains valid.
Conclusion
The EURUSD 4-hour chart highlights a strong bullish trend, with Gray Wave 3 developing within Orange Wave 3. The completion of Gray Wave 2 signals a continuation of bullish momentum, paving the way for further upward movement.
Traders should monitor price action above 1.02098 to confirm wave strength and refine their trading strategies accordingly.
Technical Analyst: Malik Awais
Source: visit Tradinglounge.com and learn From the Experts Join TradingLounge Here
Previous: EURGBP Elliott Wave Technical Analysis
VALUE Offer - Buy 1 Month & Get 3 Months!Click here
Access 7 Analysts Over 200 Markets Covered. Chat Room With Support