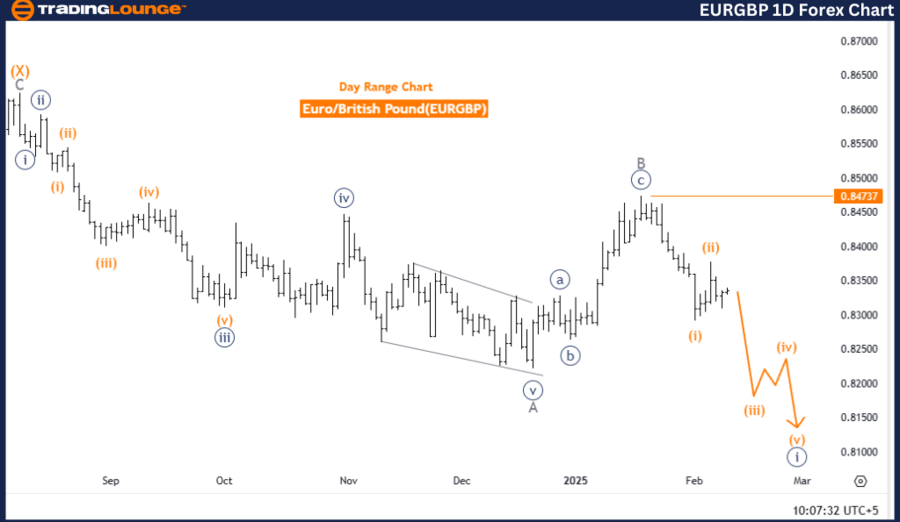
Euro/British Pound (EUR/GBP) – TradingLounge Day Chart
EUR/GBP Elliott Wave Technical Analysis
Function: Bearish Trend
Mode: Impulsive
Structure: Orange Wave 3
Position: Navy Blue Wave 1
Direction Next Higher Degrees: Orange Wave 4
Details: Orange Wave 2 has likely completed, with Orange Wave 3 now unfolding.
Wave Cancel Invalidation Level: 0.84737
EUR/GBP Day Chart Analysis Overview
The EUR/GBP day chart confirms a bearish trend, analyzed using Elliott Wave Theory within an impulsive structure. The market is currently in Orange Wave 3, a crucial stage in the downward cycle known for strong price declines and growing selling pressure.
At this phase, Navy Blue Wave 1 is developing, signaling the early stages of an extended bearish cycle. With Orange Wave 2 appearing complete, the corrective phase has ended, allowing Orange Wave 3 to gain momentum. This stage is often associated with aggressive bearish movement, increasing trading opportunities as downside momentum strengthens.
Bearish Momentum & Trading Implications
As Orange Wave 3 progresses, bearish momentum intensifies, leading to heightened market volatility and further downside risk. The wave cancel invalidation level is set at 0.84737, meaning any price movement above this level would invalidate the existing Elliott Wave count, necessitating a revised market outlook.
This phase demands close tracking of price action, as it represents a pivotal moment in the ongoing bearish cycle. Traders should watch for momentum indicators, key resistance levels, and price action signals that may influence future market behavior.
Conclusion
The EUR/GBP day chart signals a strong bearish outlook, with an emphasis on the impulsive movement of Orange Wave 3 within Navy Blue Wave 1. The confirmed completion of Orange Wave 2 strengthens expectations for continued downward pressure, presenting strategic trading opportunities.
Monitoring price action near the 0.84737 invalidation level is critical to refining trading strategies and validating the current Elliott Wave count.
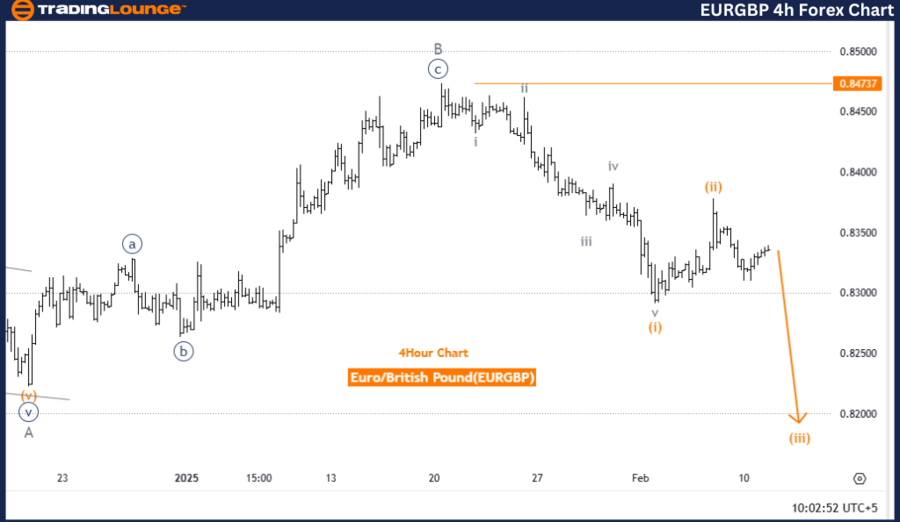
Euro/British Pound (EUR/GBP) – TradingLounge 4-Hour Chart
EUR/GBP Elliott Wave Technical Analysis
Function: Bearish Trend
Mode: Impulsive
Structure: Orange Wave 3
Position: Navy Blue Wave 1
Direction Next Higher Degrees: Orange Wave 4
Details: Orange Wave 2 has likely completed, with Orange Wave 3 now in progress.
Wave Cancel Invalidation Level: 0.84737
EUR/GBP 4-Hour Chart Analysis Overview
The EUR/GBP 4-hour chart confirms a bearish trend aligned with Elliott Wave Theory in an impulsive phase. The market is currently within Orange Wave 3, which is typically associated with strong downward pressure, increasing selling activity, and notable price declines.
At this juncture, the position within Navy Blue Wave 1 suggests that the bearish trend is still in its early stages, indicating potential for further downside movement. With Orange Wave 2 completed, the corrective phase has ended, reinforcing the continuation of bearish momentum as Orange Wave 3 gains strength.
Bearish Momentum & Trading Implications
As Orange Wave 3 accelerates, selling pressure continues to rise, reinforcing the broader bearish sentiment. Traders should closely observe price action shifts, volatility spikes, and momentum indicators, as this wave often presents prime short-selling opportunities within the downward cycle.
The wave cancel invalidation level is set at 0.84737. If price action breaches this level, the current Elliott Wave count would no longer hold, requiring a re-evaluation of the market structure. Active monitoring of price movements near this threshold is essential for maintaining an accurate market perspective.
Conclusion
The EUR/GBP 4-hour chart reinforces a bearish market bias, led by the development of Orange Wave 3 within Navy Blue Wave 1. The completion of Orange Wave 2 signals an aggressive shift in bearish momentum, increasing potential trading opportunities for trend-following strategies.
Staying alert to price action near the invalidation level (0.84737) is vital for ensuring that trading decisions remain in sync with the prevailing bearish trend.
Technical Analyst: Malik Awais
Source: visit Tradinglounge.com and learn From the Experts Join TradingLounge Here
Previous: GBPUSD Elliott Wave Technical Analysis
VALUE Offer - Buy 1 Month & Get 3 Months!Click here
Access 7 Analysts Over 200 Markets Covered. Chat Room With Support