TATA STEEL – TATASTEEL (1D Chart) Elliott Wave Technical Analysis
TATA STEEL Elliott Wave Technical Analysis
Function: Counter Trend (Minor degree, Grey)
Mode: Corrective
Structure: Impulse within Larger degree Zigzag
Position: Minor Wave 2 Grey
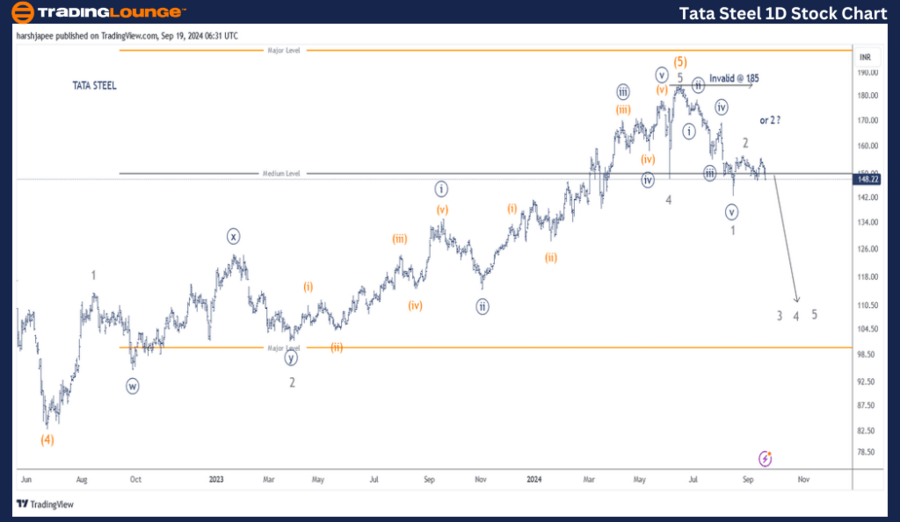
Details: TATA Steel’s major top may have been established around the 185 level. The stock has since declined impulsively to 142, marking the end of potential Minor Wave 1 Grey. Wave 2 Grey might have concluded just below the 160 level. If this analysis is correct, Wave 3 Grey is currently in progress. Alternatively, there is a possibility that Wave 2 Grey could extend up to the 170 level.
Invalidation point: 185
TATA Steel Daily Chart Technical Analysis and Potential Elliott Wave Counts
The daily chart of TATA Steel suggests that a major top formed around the 185 mark on June 14, 2024. This is identified as Minor Wave 5 Grey of Intermediate Wave (5) Orange. Afterward, the stock initiated an impulsive decline, marking Minor Wave 1 Grey, which reached 142. Currently, the stock is unfolding potential Wave 2 Grey.
The prior uptrend concluded Intermediate Wave (4) Orange near 83 in June 2022. From there, a rally unfolded, subdivided into Minor Waves 1 through 5, culminating around the 185 level. Minor Wave 2 developed as a combination, while Wave 3 extended.
If the suggested wave structure remains intact, TATA Steel is progressing through a counter-trend zigzag at Minor degree. Minor Wave 1 is likely complete around 142, while Minor Wave 2 could either be finished at 155 or extend further toward the 170 mark.
TATA STEEL – TATASTEEL (4H Chart) Elliott Wave Technical Analysis
TATA STEEL Elliott Wave Technical Analysis
Function: Counter Trend (Minor degree, Grey)
Mode: Corrective
Structure: Impulse within Larger degree Zigzag
Position: Minor Wave 2 Grey
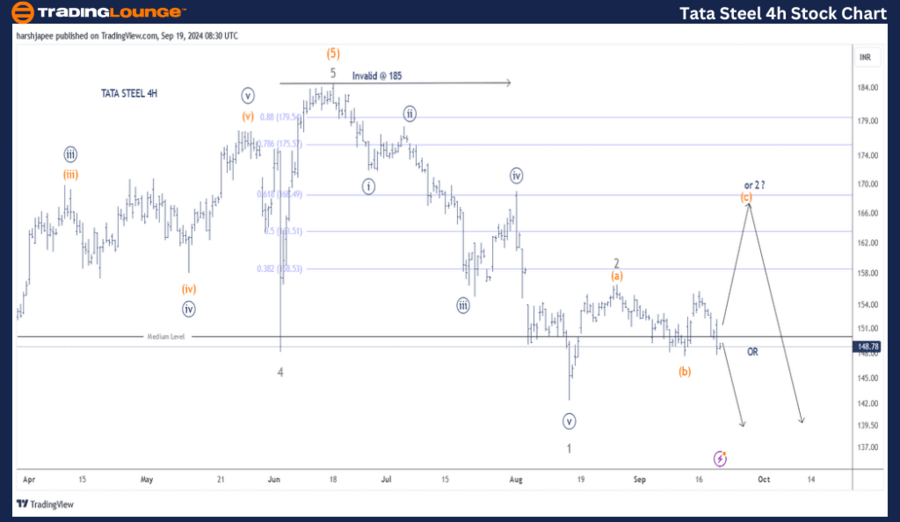
Details: A major top is likely in place at the 185 mark. Following this, the stock declined impulsively to 142, completing potential Minor Wave 1 Grey. Wave 2 Grey could be complete just below 160, with Wave 3 Grey potentially underway. Alternatively, Wave 2 Grey may push further toward the 170 level within a Minuette (a)-(b)-(c) orange formation.
Invalidation point: 185
TATA Steel 4H Chart Technical Analysis and Potential Elliott Wave Counts
The 4H chart of TATA Steel shows the recent wave count since the 185 high reached in June 2024. An impulsive decline to 142 terminated Minor Wave 1 Grey, and the stock is currently progressing within Minor Wave 2 Grey. If this analysis is accurate, Minor Wave 3 Grey is expected to begin soon.
Technical Analyst: Harsh Japee
Source: visit Tradinglounge.com and learn From the Experts Join TradingLounge Here
Previous: SBILIFE Elliott Wave Technical Analysis
VALUE Offer - Buy 1 Month & Get 3 Months!Click here
Access 7 Analysts Over 200 Markets Covered. Chat Room With Support
Conclusion:
TATA Steel appears to be progressing within a counter-trend Minor Wave 2 Grey, which could extend toward the 170 level. Once this corrective wave concludes, the stock is likely to resume its downtrend as Minor Wave 3 Grey unfolds.