Hindalco Industries – HINDALCO Elliott Wave Analysis (1D Chart)

Function: Larger Degree Trend Higher (Intermediate degree, orange)

Mode: Motive

Structure: Impulse

Position: Minor Wave 5 (Grey)

Details: Minor Wave 5 Grey is progressing higher within Intermediate Wave (5) against the 595 level. No changes in structure.

Invalidation Point: 595-600

HINDALCO Elliott Wave Technical Analysis

Hindalco Industries Daily Chart Technical Analysis and Elliott Wave Counts

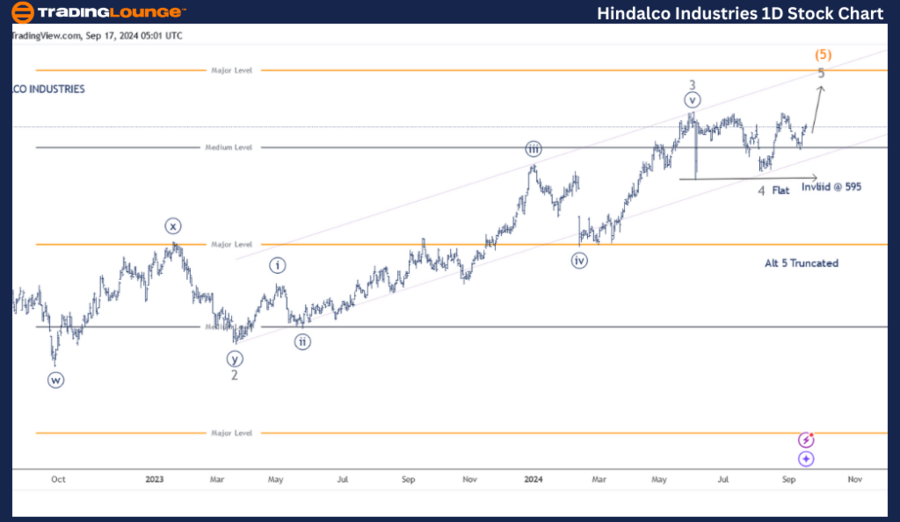
The daily chart of Hindalco Industries suggests the stock is moving higher, aiming to complete Minor Wave 5 Grey and Intermediate Wave (5) Orange beyond the 720 mark. Alternatively, Wave 5 might have completed truncated near 715.

The stock has been rising within Intermediate Wave (5) Orange since June 2022, following a low near 310, which marked the end of Wave (4). Minor Waves 1 through 3 appear complete, with the third wave showing an extended move.

Minor Wave 4 ended as a flat just above the 595 level, and now, the final wave is pushing higher. If the proposed Elliott Wave structure holds, the stock should remain above 595 and continue its upward trend. A break below this level would require a reevaluation of the wave counts.

Hindalco-Industries-...


HINDALCO INDUSTRIES – HINDALCO Elliott Wave Analysis (4H Chart)

Function: Larger Degree Trend Higher (Intermediate degree, orange)

Mode: Motive

Structure: Impulse

Position: Minor Wave 5 (Grey)

Details: Minor Wave 5 Grey is advancing within Intermediate Wave (5) against the 595 level. Alternatively, Wave 5 may have truncated around 715.

Invalidation Point: 595-600

Hindalco Industries 4H Chart Technical Analysis and Elliott Wave Counts

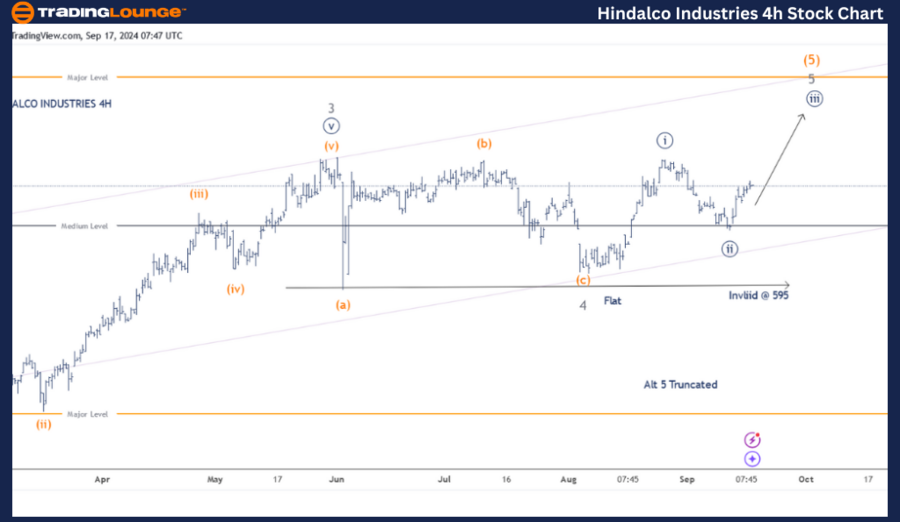
The 4H chart of Hindalco Industries illustrates the development of sub-waves within Minute Wave ((v)) of Minor Wave 3 Grey. Minor Wave 4 Grey might have completed as a running flat above the 600 mark. If accurate, Minor Wave 5 is currently in progress, with Minute Waves ((i)) and ((ii)) likely complete.

Technical Analyst: Harsh Japee

Source: visit Tradinglounge.com and learn From the Experts Join TradingLounge Here 

Previous: Bharti Airtel Elliott Wave Technical Analysis

Special Trial Offer - 0.76 Cents a Day for 3 Months! Click here

Access 7 Analysts Over 200 Markets Covered. Chat Room With Support

Hindalco-Industries-...


Conclusion:

Hindalco Industries is advancing within Minute Wave ((iii)) of Minor Wave 5 Grey, moving higher against the 595 level.

Related

British Pound/U.S. Dollar(GBPUSD) Elliott Wave Technical Analysis 30 January 24

British Pound/U.S. Dollar(GBPUSD) Elliott Wave Technical Analysis 30 January 24

Trading Lounge Day and 4H Chart for GBPUSD Elliott Wave Analysis dated 30 January 24, provides a det...

Read More >
Elliott Wave Analysis for Asian Paints Stock: Price Predictions and Forecast with Insights into the Stock's Possible Trajectory

Elliott Wave Analysis for Asian Paints Stock: Price Predictions and Forecast with Insights into the Stock's Possible Trajectory

This article provides an in-depth Elliott Wave analysis for Asian Paints stock, including key techni...

Read More >
Avery Dennison Corp. (AVY) Stock Analysis: Elliott Wave Technical  Forecast and Investment Insights for Better Trading Decisions

Avery Dennison Corp. (AVY) Stock Analysis: Elliott Wave Technical Forecast and Investment Insights for Better Trading Decisions

Avery Dennison (AVY) stock, offers insights into technical patterns, potential price movements, and ...

Read More >
BLOCK INC (SQ2) ASX Elliott Wave Analysis: Stock Forecast, Breakout Targets, Invalidation Points, and Trading Strategies for Investors

BLOCK INC (SQ2) ASX Elliott Wave Analysis: Stock Forecast, Breakout Targets, Invalidation Points, and Trading Strategies for Investors

This analysis covers BLOCK INC (SQ2) Elliott Wave technical patterns, highlighting breakout targets,...

Read More >
Comprehensive Analysis of the Swiss Market Index (SMI) delves into the Elliott Wave Technical Analysis: day and weekly charts

Comprehensive Analysis of the Swiss Market Index (SMI) delves into the Elliott Wave Technical Analysis: day and weekly charts

This comprehensive analysis of the Swiss Market Index (SMI) delves into the Elliott Wave patterns on...

Read More >
Insightful Day and 4-Hour Chart Review: British Pound/Japanese Yen(GBPJPY) Forex Elliott Wave Technical Analysis

Insightful Day and 4-Hour Chart Review: British Pound/Japanese Yen(GBPJPY) Forex Elliott Wave Technical Analysis

This comprehensive guide offers detailed GBPJPY trading analysis, focusing on Elliott Wave forecasts...

Read More >

$1 for 2 Weeks

then $29 a month!

What a Special Offer!

Trade Recommendations

Unleash the power of deversified trading with our comprehensive portfolio, covering 250+ markets:

  • Stock Trades
  • Crypto Trades
  • Forex Trades
  • Commodity Trades
Elliott Wave Analysis

Gain a competitive edge with expert insights and AI-powered Elliott Wave charting into:

  • Global Indices
  • US Stocks & ASX Stocks
  • Forex & Crypto
  • Commodities
Top-Notch Trading Tools

Equip yourself with the tools of success:

  • Real-time Chat rooms
  • Elliott Wave Algorithm
  • Portfolio tools
  • TradingLevels
  • Screener
  • Trading Game
7 Elliott Wave Analysts

Stay ahead of the market with daily charts and insightful videos
Your secret to strategic trading!

JOIN HERE


Welcome to TradingLounge (ASIC A.R.No. 321187), specialists in trades, trading education and technical analysis, covering stocks, indices, commodities, forex and cryptocurrencies.

When you join TradingLounge you have access to everything we offer, including trade tools, educational content and a social platform to chat with like-minded investors.

Read more

@Copyright 2024 by tradinglounge.com

Contact Us

Australian no: 02 4787 6020

International no: +61 (2) 47876020

Pay with:

Find us on