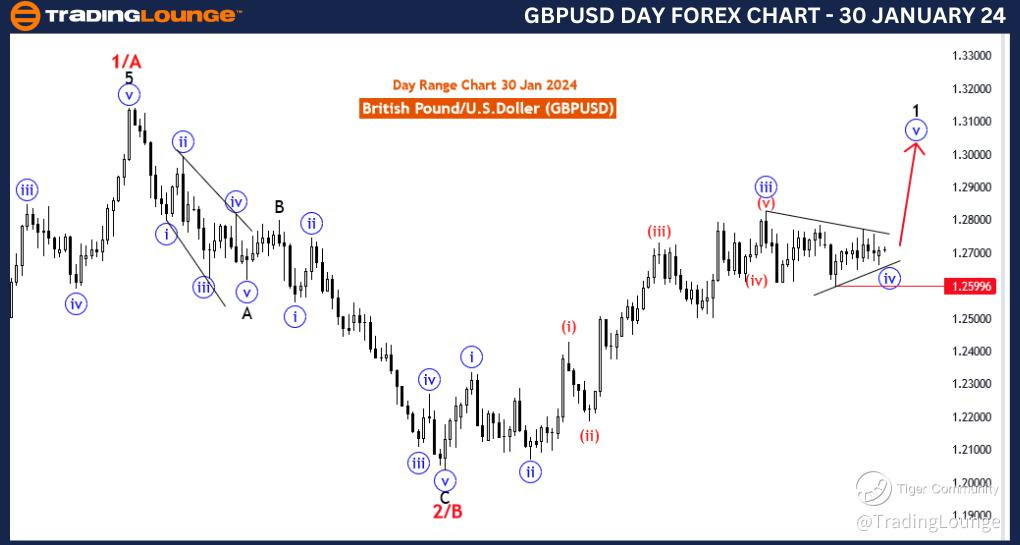
GBPUSD Elliott Wave Analysis Trading Lounge 4 Hour Chart, 30 January 24
British Pound/U.S.Dollar (GBPUSD) 4 Hour Chart
GBPUSD Elliott Wave Technical Analysis
FUNCTION: Trend
MODE: Corrective
STRUCTURE: blue wave 4 of 1
POSITION: Red wave 3/C
DIRECTION NEXT HIGHER DEGREES: blue wave 5 of 1
DETAILS: blue wave 4 of black wave 1 still is in play as sideways . Wave Cancel invalid level: 1.25996
The "GBPUSD Elliott Wave Analysis Trading Lounge 4 Hour Chart" dated 30 January 24, provides a comprehensive analysis of the British Pound/U.S. Dollar (GBPUSD) currency pair, focusing on the 4-hour chart and utilizing Elliott Wave Technical Analysis.
The "FUNCTION" is identified as "Trend," indicating that the analysis is geared toward identifying potential movements in the direction of the prevailing trend. This suggests an expectation of a continuation of the broader trend in GBPUSD.
The "MODE" is labeled as "Corrective," implying that the current market phase involves price movements that are counter to the primary trend. Corrective waves are typically denoted as A-B-C structures.
The "STRUCTURE" is specified as "blue wave 4 of 1," indicating the current wave count within the Elliott Wave framework. This suggests that the market is currently in the fourth wave of a larger degree pattern labeled as 1.
The "POSITION" is defined as "Red wave 3/C," highlighting the specific subwave within the broader Elliott Wave count. Red wave 3 is part of the larger corrective structure.
Regarding "DIRECTION NEXT HIGHER DEGREES," the analysis points to "blue wave 5 of 1," indicating the next expected movement within the broader Elliott Wave pattern. This implies an anticipation of an upcoming fifth wave to complete the larger degree pattern.
In terms of "DETAILS," it mentions that "blue wave 4 of black wave 1 still is in play as sideways." This indicates that the current corrective phase is unfolding as a sideways movement, possibly characterized by a consolidation pattern.
The "Wave Cancel invalid level" is specified as "1.25996," serving as a crucial reference point. A breach of this level could potentially invalidate the current wave count, prompting traders to closely monitor price movements around this level.
In summary, the GBPUSD Elliott Wave Analysis for the 4-hour chart on 30 January 24, suggests an ongoing corrective movement (blue wave 4 of 1) characterized by sideways price action. Traders are advised to pay close attention to market developments, especially focusing on the invalidation level at 1.25996.
Technical Analyst: Malik Awais
Source: Tradinglounge.com, Learn From the Experts Join TradingLounge Here
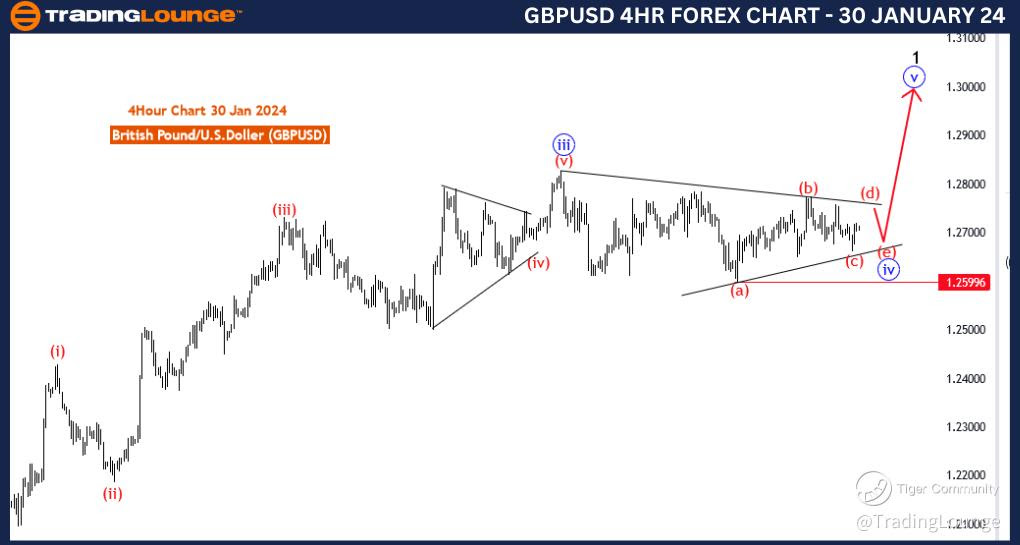
GBPUSD Elliott Wave Analysis Trading Lounge Day Chart, 30 January 24
British Pound/U.S.Dollar (GBPUSD) Day Chart
GBPUSD Elliott Wave Technical Analysis
FUNCTION: Trend
MODE: Corrective
STRUCTURE: blue wave 4 of 1
POSITION: Red wave 3/C
DIRECTION NEXT HIGHER DEGREES: blue wave 5 of 1
DETAILS: blue wave 4 of black wave 1 still is in play as sideways . Wave Cancel invalid level: 1.25996
The "GBPUSD Elliott Wave Analysis Trading Lounge Day Chart" dated 30 January 24, provides a detailed analysis of the British Pound/U.S. Dollar (GBPUSD) currency pair, focusing on the daily chart and utilizing Elliott Wave Technical Analysis.
The identified "FUNCTION" is "Trend," indicating that the analysis aims to discern potential movements in the direction of the overarching trend. This suggests an expectation of a continuation of the broader trend in GBPUSD.
The "MODE" is specified as "Corrective," implying that the current market phase involves price movements that are counter to the primary trend. Corrective waves are often characterized by sideways or zigzag patterns.
The "STRUCTURE" is labeled as "blue wave 4 of 1," indicating the current wave count within the Elliott Wave framework. This implies that the market is currently in the fourth wave of a larger degree pattern labeled as 1.
The "POSITION" is defined as "Red wave 3/C," highlighting the specific subwave within the broader Elliott Wave count. Red wave 3 is part of the larger corrective structure.
Regarding "DIRECTION NEXT HIGHER DEGREES," the analysis points to "blue wave 5 of 1," indicating the next expected movement within the broader Elliott Wave pattern. This implies an anticipation of an upcoming fifth wave to complete the larger degree pattern.
In terms of "DETAILS," it mentions that "blue wave 4 of black wave 1 still is in play as sideways." This indicates that the current corrective phase is unfolding as a sideways movement, possibly suggesting a consolidation pattern.
The "Wave Cancel invalid level" is specified as "1.25996," serving as a crucial reference point. A breach of this level could potentially invalidate the current wave count, prompting traders to closely monitor price movements around this level.
In summary, the GBPUSD Elliott Wave Analysis for the daily chart on 30 January 24, suggests an ongoing corrective movement (blue wave 4 of 1) characterized by sideways price action. Traders are advised to closely monitor the market, especially focusing on the invalidation level at 1.25996.
Technical Analyst: Malik Awais
Source: Tradinglounge.com, Learn From the Experts Join TradingLounge Here
PREVIOUS: U.S.Dollar/Japanese Yen (USDJPY)