SPDR Select Sector Fund ETF (XLF) – TradingLounge Daily Chart
SPDR Select Sector Fund ETF (XLF) Daily Chart Analysis
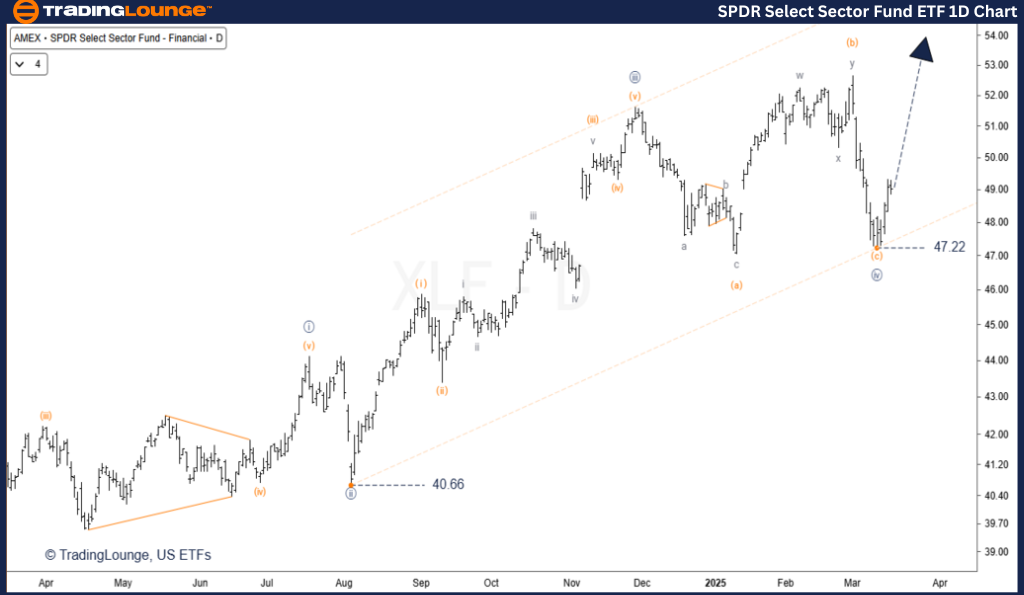
SPDR Select Sector Fund ETF (XLF) Elliott Wave Technical Analysis
Function: Major Trend
Mode: Motive
Structure: Impulse Wave
Position: Wave 5 Navy
Direction: Uptrend
Details:
- The 4th wave found support at $47.22, forming a flat correction pattern.
- The ongoing rally is in its early stages and aims to fully retrace Wave 4 within a five-wave upward structure.
Minimum target: $54.00, aligning with the upper boundary of Elliott’s final channel.
Invalidation Level: $47.22—a drop below this level would nullify the current wave count.
SPDR Select Sector Fund ETF (XLF) – TradingLounge 4-Hour Chart Analysis
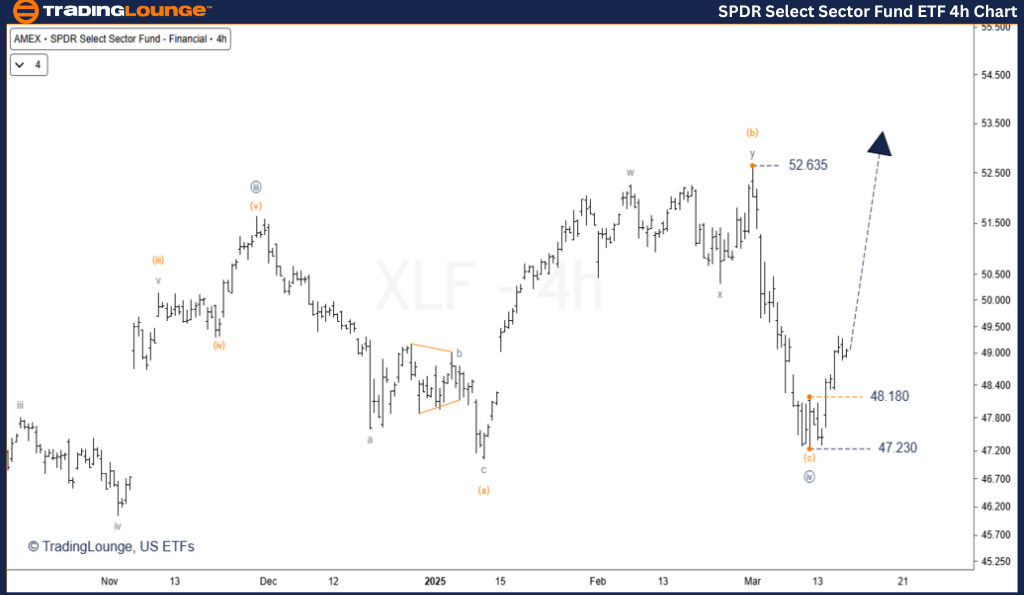
SPDR Select Sector Fund ETF (XLF) 4-Hour Chart Analysis
Function: Major Trend
Mode: Motive
Structure: Impulse
Position: Wave 5 Navy
Direction: Uptrend
Details:
- Wave 4 has successfully ended within the projected KTL time range, confirming the Elliott wave count.
- The ongoing rally in Wave 5 signals a potential strong buying opportunity.
- A temporary pullback (throwback) is likely before the uptrend resumes, offering an optimal entry point.
- The $52.635 high is expected to be surpassed in the current wave formation.
Key Level: $48.18—watch this level for potential support.
Invalidation Level: $47.23—a decline below this mark would negate the bullish structure.
Technical Analyst: Siinom
Source: Visit Tradinglounge.com and learn from the Experts. Join TradingLounge Here
See Previous: SPDR Select Sector Fund ETF – XLF Elliott Wave Technical Analysis
VALUE Offer - Buy 1 Month & Get 3 Months!Click here
Access 7 Analysts Over 200 Markets Covered. Chat Room With Support
Conclusion
- The 4th wave correction in XLF has been completed, confirming a wave cycle reset.
- The current rally is part of the 5th wave, reinforcing the strong bullish outlook.
- A pullback within the fifth-wave substructure is possible before a significant rally unfolds.
- This bullish setup presents a favourable long-position opportunity for ETF traders.
- Traders should adhere to Elliott Wave principles and closely monitor invalidation levels to manage risk effectively.
This analysis provides a technical roadmap for navigating XLF's wave cycle while maintaining optimal risk-reward strategies.