McDonald's Corp. (MCD) Elliott Wave Market Analysis
This McDonald's Corp. (MCD) analysis evaluates both daily and 1-hour charts using Elliott Wave Theory to track market trends and predict future price movements.
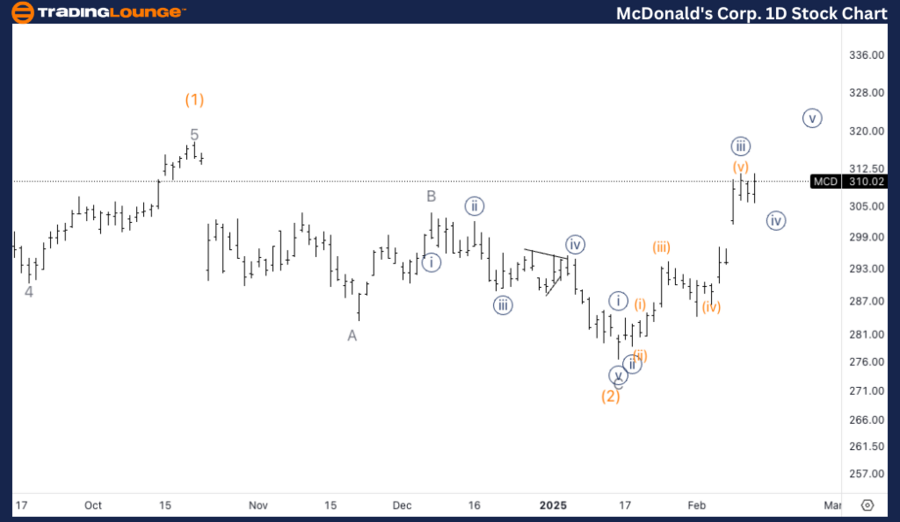
McDonald's Corp. (MCD) Elliott Wave Analysis - Trading Lounge Daily Chart
MCD Elliott Wave Technical Analysis
Function: Trend
Mode: Impulsive
Structure: Motive
Position: Wave 1 of (3)
Direction: Approaching a peak in wave 1
Details: A minor wave 1 top is forming, expected near the previous wave (1) high. A short-term pullback is anticipated before MCD resumes its uptrend beyond $300.
Daily Chart Summary
McDonald's (MCD) is in the final stage of impulsive wave 1 of (3). The minor wave 1 peak is expected soon, aligning with the previous wave (1) high. After this peak, a corrective pullback is likely before the next bullish wave surpasses $300.
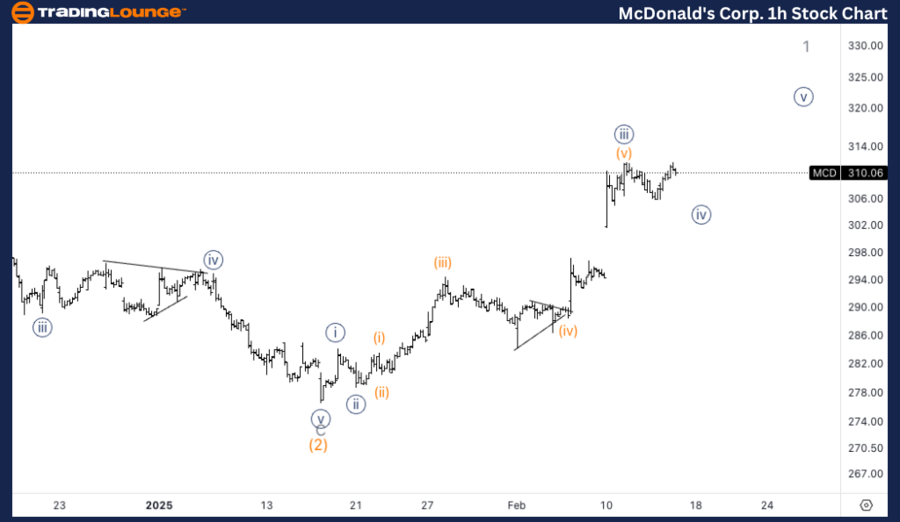
MCD Elliott Wave Technical Analysis - 1H Chart
Function: Trend
Mode: Impulsive
Structure: Motive
Position: Wave {iv} of 1
Direction: Nearing the bottom in wave {iv}
Details: Wave 1 is subdividing, and a final push in wave {v} is expected to complete the current bullish cycle.
1-Hour Chart Summary
On the 1-hour chart, MCD is completing wave {iv} of 1. Once this correction ends, wave {v} should push higher, marking the final movement of wave 1’s uptrend. This will confirm minor wave 1’s peak, setting the stage for the next Elliott Wave pattern.
Technical Analyst: Alessio Barretta
Source: visit Tradinglounge.com and learn From the Experts Join TradingLounge Here
See Previous: CSX Corp. (CSX) Elliott Wave Technical Analysis