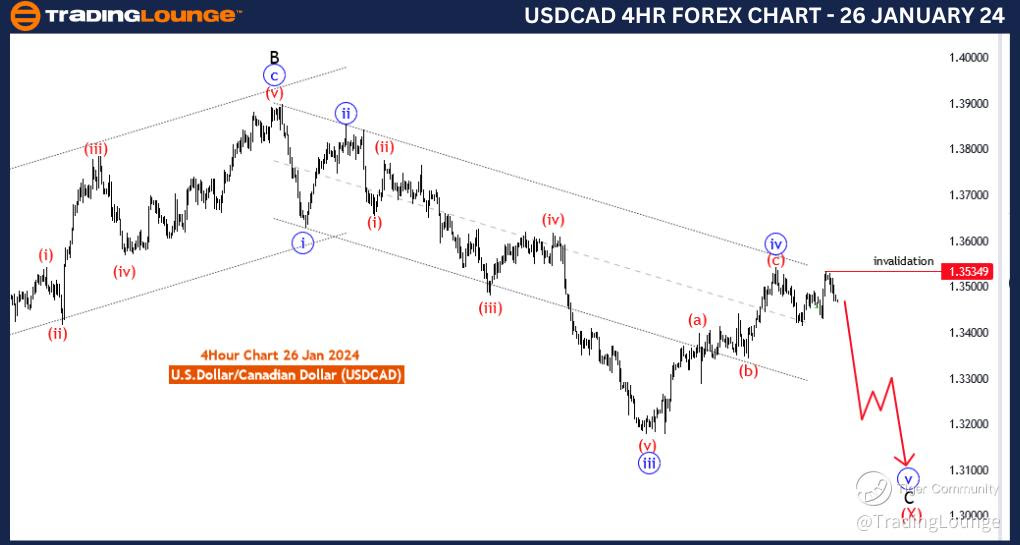
USD/CAD Elliott Wave Analysis Trading Lounge 4 Hour Chart, 26 January 24
U.S.Dollar /Canadian Dollar(USD/CAD) 4 Hour Chart
USD/CAD Elliott Wave Technical Analysis
FUNCTION: Counter Trend
MODE: impulsive
STRUCTURE: Elliot wave 5 of C
POSITION: black wave C
DIRECTION NEXT LOWER DEGREES: blue wave 5 (started)
DETAILS: blue wave 4 looking completed at 1.35428 . Now blue wave 5 of C is in play . Wave Cancel invalid level:1.35349
The "USD/CAD Elliott Wave Analysis Trading Lounge 4 Hour Chart" for 26 January 24, provides a detailed analysis of the U.S. Dollar/Canadian Dollar (USD/CAD) currency pair using Elliott Wave theory, a popular tool in technical analysis.
The specified "Function" is identified as "Counter Trend," indicating that the analysis is focused on potential corrective movements against the prevailing trend. This suggests a temporary interruption in the primary downtrend.
The "Mode" is described as "Impulsive," suggesting that within the counter-trend context, the current phase involves forceful and directional price movements. This impulsive mode is often characterized by five-wave structures.
The "Structure" is designated as "Elliott Wave 5 of C," pointing to the specific wave count within the broader Elliott Wave pattern. Elliott Wave 5 is typically the final phase of the sequence, representing the last leg of the current trend.
The "Position" is noted as "black wave C," indicating the current phase in the Elliott Wave count. Black wave C is a subwave within the larger context of the Elliott Wave structure.
The "Direction Next Lower Degrees" highlights "blue wave 5 (started)," suggesting that the analysis is considering the ongoing subwave within the broader structure. This is essential for understanding the potential trajectory of the current movement.
In the "Details" section, it's mentioned that "blue wave 4 looking completed at 1.35428." This signals the end of a corrective phase within the broader Elliott Wave count. Additionally, the analysis indicates that "blue wave 5 of C is in play," signaling the initiation of the next impulsive phase.
The "Wave Cancel invalid level" is specified as "1.35349." This level serves as a critical reference point, suggesting that a breach of this level could invalidate the current wave count. Traders often use such levels to reassess their positions and adapt to changing market dynamics.
In summary, the USD/CAD Elliott Wave Analysis for the 4 Hour Chart on 26 January 24, indicates an impulsive counter-trend movement, with blue wave 5 of C in progress. Traders are advised to monitor the market closely, with a focus on the invalidation level at 1.35349.
Technical Analyst: Malik Awais
Source: Tradinglounge.com get trial here!
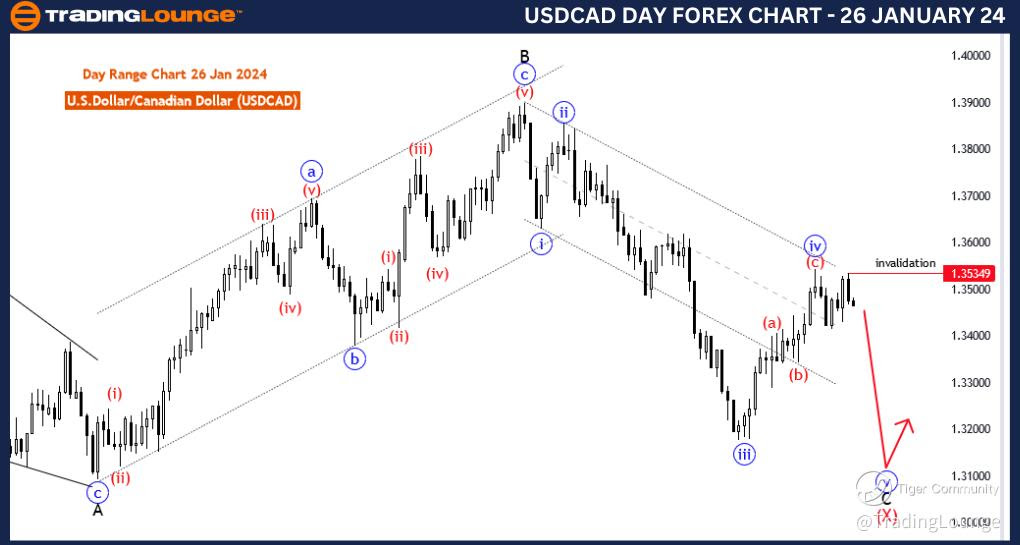
USD/CAD Elliott Wave Analysis Trading Lounge Day Chart, 26 January 24
U.S.Dollar /Canadian Dollar(USD/CAD) Day Chart
USD/CAD Elliott Wave Technical Analysis
FUNCTION: Counter Trend
MODE: impulsive
STRUCTURE: Elliot wave 5 of C
POSITION: black wave C
DIRECTION NEXT LOWER DEGREES: blue wave 5 (started)
DETAILS: blue wave 4 looking completed at 1.35428 . Now blue wave 5 of C is in play . Wave Cancel invalid level:1.35349
The "USD/CAD Elliott Wave Analysis Trading Lounge Day Chart" for 26 January 24, delves into the technical analysis of the U.S. Dollar/Canadian Dollar (USD/CAD) currency pair using the Elliott Wave theory, a methodology widely employed for forecasting market trends.
The analysis categorizes the market's "Function" as "Counter Trend," implying that the focus is on potential corrective movements against the primary trend. This suggests an expectation of a temporary reversal within the overarching downtrend.
The "Mode" is described as "Impulsive," indicating that the current market phase involves forceful and directional price movements. Impulsive waves are often characterized by five-wave structures, representing the strong directional move.
The "Structure" is specified as "Elliott Wave 5 of C," suggesting the wave count within the broader Elliott Wave pattern. In Elliott Wave theory, Wave 5 is typically the final phase of the sequence, marking the last leg of the current trend.
The "Position" is identified as "black wave C," indicating the current wave within the Elliott Wave count. Black wave C is a subwave within the larger context of the Elliott Wave structure.
In terms of the "Direction Next Lower Degrees," the analysis highlights "blue wave 5 (started)," which suggests that within the broader Elliott Wave 5 of C, the subwave of blue wave 5 has commenced. This is crucial for understanding the potential trajectory of the ongoing movement.
The "Details" section notes that "blue wave 4 looking completed at 1.35428." This signifies the end of a corrective phase within the Elliott Wave count. Furthermore, the analysis points out that "blue wave 5 of C is in play," indicating the initiation of the next impulsive phase.
The "Wave Cancel invalid level" is specified as "1.35349." This level serves as a critical reference point, indicating that a breach of this level could invalidate the current wave count. Such levels are essential for risk management and decision-making in trading.
In summary, the USD/CAD Elliott Wave Analysis for the Day Chart on 26 January 24, indicates an impulsive counter-trend movement, with blue wave 5 of C in progress. Traders are advised to closely monitor the market, with a focus on the invalidation level at 1.35349.
Technical Analyst: Malik Awais
Source: Tradinglounge.com get trial here!
Previous: NZDUSD