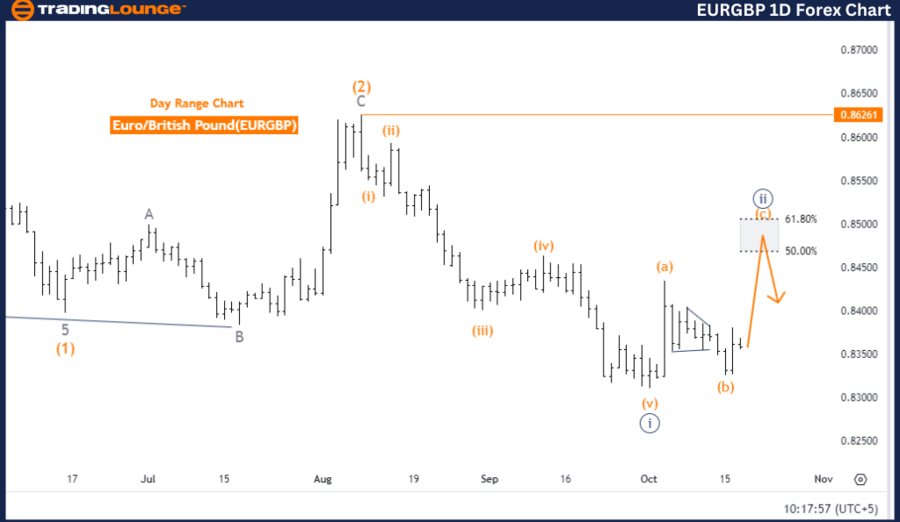
EURGBP Elliott Wave Analysis Trading Lounge - Day Chart
Euro/British Pound (EURGBP) Day Chart Analysis
EURGBP Elliott Wave Technical Analysis
Function: Counter Trend
Mode: Corrective
Structure: Navy Blue Wave 2
Position: Gray Wave 1
Direction Next Lower Degrees: Navy Blue Wave 3
Details: Navy Blue Wave 1 is now completed, and Navy Blue Wave 2 is currently unfolding.
Wave Cancel Invalidation Level: 0.86261
The daily chart for EURGBP showcases a corrective counter-trend phase based on Elliott Wave analysis. Currently, the market is in Navy Blue Wave 2, following the completion of Gray Wave 1. This corrective phase suggests a pullback in the short term before the market resumes its primary trend.
Navy Blue Wave 1, representing an impulsive move, has already been completed. Now, Navy Blue Wave 2 is active, marking a retracement within the larger wave structure. This corrective phase is expected to conclude with the start of Navy Blue Wave 3, signaling a return to the main trend.
The next key movement is expected in Navy Blue Wave 3 after the completion of Navy Blue Wave 2. This wave is likely to introduce another impulsive push in line with the broader market trend. However, during this corrective period, the market will likely consolidate.
The invalidation level for this wave structure is 0.86261. If the price moves below this level, the current wave count would be invalid, prompting a re-evaluation of the market structure. Above this level, the current wave count holds, and Navy Blue Wave 2 is expected to finalize before the next impulsive move in Navy Blue Wave 3.
Summary
- Current Phase: Corrective counter-trend (Navy Blue Wave 2).
- Next Move: Development of Navy Blue Wave 3, continuing the primary trend.
- Invalidation Level: 0.86261.
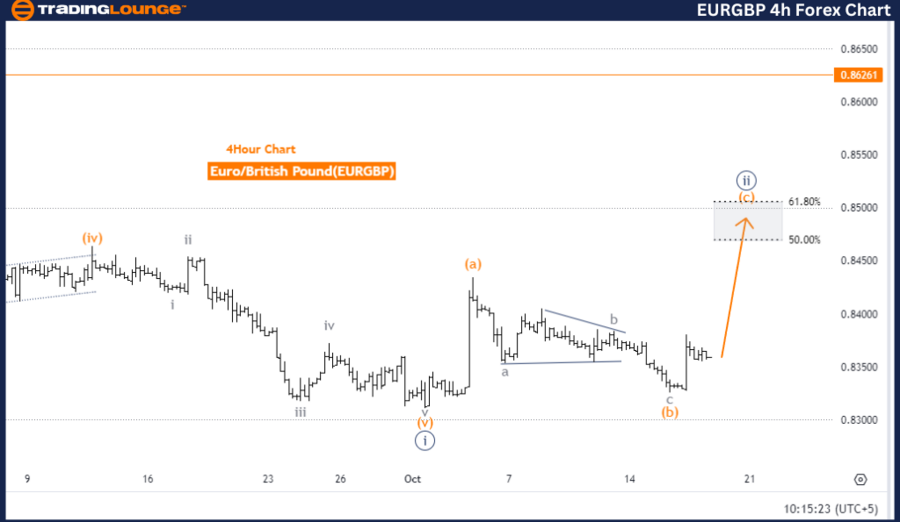
EURGBP Elliott Wave Analysis Trading Lounge - 4-Hour Chart
Euro/British Pound (EURGBP) 4 Hour Chart Analysis
EURGBP Currency Pair Technical Analysis
Function: Counter Trend
Mode: Impulsive as Wave C
Structure: Orange Wave C
Position: Navy Blue Wave 2
Direction Next Lower Degrees: Navy Blue Wave 3
Details: Orange Wave B of Navy Blue Wave 2 has completed, and now Orange Wave C is unfolding.
Wave Cancel Invalidation Level: 0.86261
The EURGBP 4-hour chart analysis also reflects a counter-trend movement. In this time frame, the market is forming an impulsive Orange Wave C within Navy Blue Wave 2, indicating that the corrective structure is nearing its end.
The structure of this wave count shows that Orange Wave B has already been completed, signaling the end of the corrective bounce. Now, Orange Wave C is active and represents the final phase of the current correction before the start of Navy Blue Wave 3. Once this wave concludes, the market is expected to revert to the main trend, initiating a fresh impulsive movement.
The next major development in the lower degrees is Navy Blue Wave 3. This wave will likely result in a new impulsive move aligned with the larger trend once Orange Wave C is finalized.
The invalidation level remains at 0.86261. If the market breaks below this level, the current wave analysis will need to be revised. As long as the price holds above 0.86261, the current wave structure remains valid, and the market is expected to complete Orange Wave C before resuming the primary trend in Navy Blue Wave 3.
Summary
- Current Phase: Corrective counter-trend (Orange Wave C).
- Next Move: Completion of Orange Wave C and the start of Navy Blue Wave 3.
- Invalidation Level: 0.86261.
Technical Analyst: Malik Awais
Source: visit Tradinglounge.com and learn From the Experts Join TradingLounge Here
Previous: U.S. Dollar / Swiss Franc (USDCHF) Elliott Wave Technical Analysis
VALUE Offer - Buy 1 Month & Get 3 Months!Click here
Access 7 Analysts Over 200 Markets Covered. Chat Room With Support