24Mar

Elliott Wave Analysis of Microsoft (MSFT) Stock with Forecast, Chart Patterns, and Technical Outlook for Smart Trading

Microsoft Inc. (MSFT) – Elliott Wave Analysis

This combined multi-timeframe Elliott Wave analysis of Microsoft (MSFT) offers valuable insight for traders. It highlights potential turning points and supports strategic decision-making during the current corrective market phase.

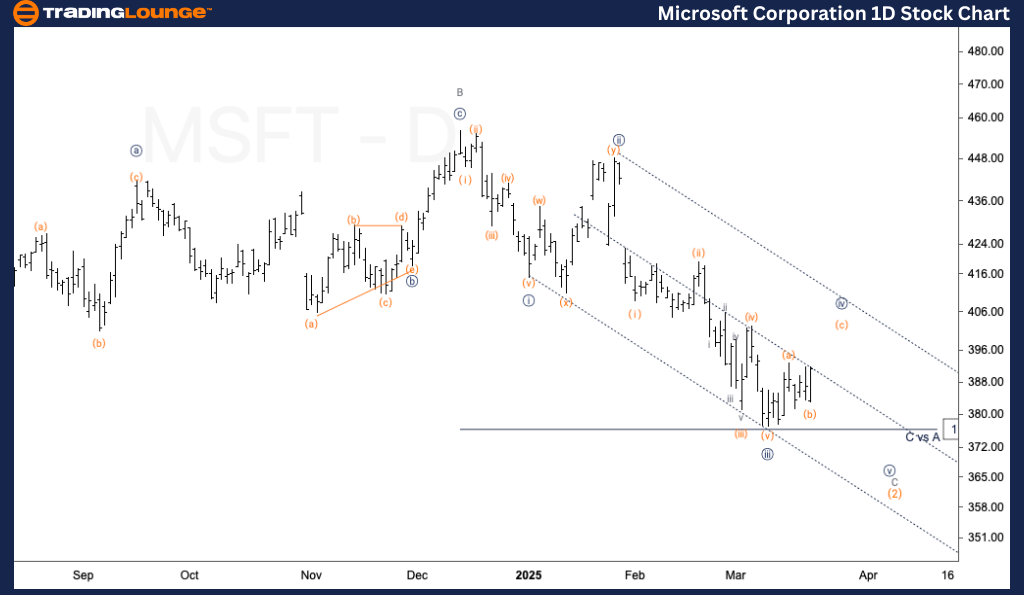
Microsoft Inc. (MSFT) – Elliott Wave Analysis by TradingLounge Daily Chart

MSFT Elliott Wave Technical Analysis

Function: Counter-Trend

Mode: Corrective

Structure: ZigZag

Position: Wave {iv} of C

Direction: Continued Downside Expected in Wave C

Details:

Microsoft Corporation (NASDAQ: MSFT) is currently in Minor wave C on the daily timeframe, according to Elliott Wave theory. So far, three sub-waves have been identified, with a visible pullback in wave {iv} of C. This indicates that the corrective wave structure is still ongoing. Additional downward movement is anticipated once this pullback completes, signaling a continuation in wave {v} of C.

Microsoft Corporation (MSFT) – Market Analysis Brief

Based on Elliott Wave analysis, Microsoft stock (MSFT) is undergoing a corrective pattern on the daily chart. The structure appears to be a ZigZag, currently in Minor wave C. A noticeable retracement within wave {iv} suggests the correction hasn't ended yet, and further decline in wave {v} could follow. Traders should prepare for more downside as the correction evolves.

Microsoft-Inc-1d-sto...


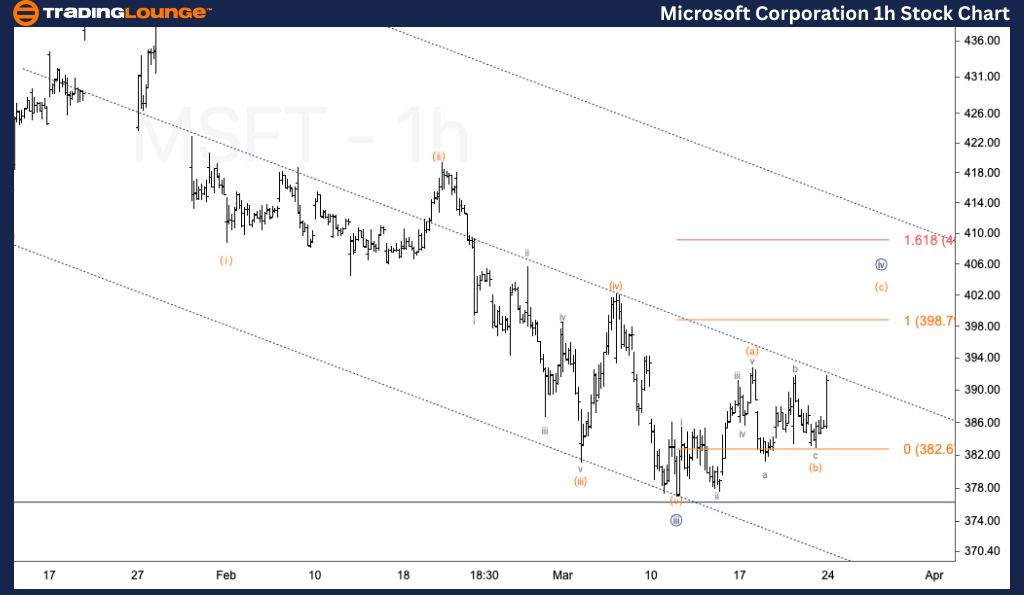
Microsoft Corporation (MSFT) Elliott Wave Analysis by TradingLounge 1-Hour Chart

Function: Counter-Trend

Mode: Corrective

Structure: ZigZag

Position: Wave (c) of {iv}

Direction: Short-Term Upside Toward Completion of Wave (c)

Details:

On the 1-hour chart, Microsoft stock shows signs that wave (b) may have concluded. The current move is likely wave (c) of {iv}, with a short-term upside target near $400. This projection is based on wave equality between waves (a) and (c). Once this rally completes, it may signal the end of wave {iv} before the price resumes its decline into wave {v}.

Microsoft Corporation (MSFT) – Market Analysis Brief

In the short-term timeframe, Elliott Wave analysis highlights an upward movement in wave (c) of {iv}, following the likely completion of wave (b). The anticipated target for wave (c) aligns near $400, providing a potential inflection point before the broader downtrend continues.

Technical Analyst: Alessio Barretta

Source: Visit Tradinglounge.com and learn from the Experts. Join TradingLounge Here 

Previous: Spotify Technology S.A. (SPOT) Elliott Wave Technical Analysis

VALUE Offer - Buy 1 Month & Get 3 Months!Click here

Access 7 Analysts Over 200 Markets Covered. Chat Room With Support

Microsoft-Inc-1h-sto...

Related

Alphabet Inc. (GOOGL) Stocks Elliott Wave Technical Analysis: Technical Insights and Future Stock Predictions

Alphabet Inc. (GOOGL) Stocks Elliott Wave Technical Analysis: Technical Insights and Future Stock Predictions

This article provides a comprehensive GOOGL Elliott Wave analysis, detailing Alphabet Inc.'s sto...

Read More >
Understanding MSTR US Stock Market Trajectory and Support Levels: MicroStrategy Inc. (MSTR) Elliott Wave Technical Analysis

Understanding MSTR US Stock Market Trajectory and Support Levels: MicroStrategy Inc. (MSTR) Elliott Wave Technical Analysis

Explore the Elliott Wave Theory as applied to MicroStrategy Inc. (MSTR), providing a comprehensive a...

Read More >
Salesforce Inc Stock Trading Signals and Price Action Insights for Better Investment Decisions: SMCI Elliott Wave Technical Analysis

Salesforce Inc Stock Trading Signals and Price Action Insights for Better Investment Decisions: SMCI Elliott Wave Technical Analysis

This SMCI Elliott Wave analysis provides an in-depth technical outlook on Super Micro Computer Inc. ...

Read More >
Tata Consumer Product Stocks Elliott Wave Technical Analysis and Tata Share Current Trend, Potential Price Movement

Tata Consumer Product Stocks Elliott Wave Technical Analysis and Tata Share Current Trend, Potential Price Movement

This article provides a comprehensive analysis of Tata Consumer Product using Elliott Wave theory. I...

Read More >
Current Market Movements in U.S. Dollar / Canadian Dollar Currency Pair | USD/CAD Elliott Wave Technical Analysis

Current Market Movements in U.S. Dollar / Canadian Dollar Currency Pair | USD/CAD Elliott Wave Technical Analysis

This article provides an in-depth USD/CAD Elliott Wave Analysis for both daily and 4-hour charts. It...

Read More >
Theta Token/U.S. dollar(THETAUSD) Elliott Wave Technical Analysis 30 October 23

Theta Token/U.S. dollar(THETAUSD) Elliott Wave Technical Analysis 30 October 23

Elliott Wave Analysis TradingLounge Daily Chart, 30 October 23,Theta Token/U.S. dollar(THETAUSD)THET...

Read More >

Buy 1 Month

Get 3 Months!

Special Offer:

Trade Recommendations

Unleash the power of deversified trading with our comprehensive portfolio, covering:

  • Stock Trades
  • Crypto Trades
  • Forex Trades
  • Commodity Trades
Elliott Wave Analysis

Gain a competive edge with expert insights in to:

  • Global Indices
  • US Stocks & ASX Stocks
  • Forex & Crypto
  • Commodities
Top-Notch Trading Tools

Equip yourself with the tools of success:

  • Social Chat
  • Elliott Wave Algorithm
  • Screener
  • TradingLevels
  • Trading Game
7 Elliott Wave Analysts

Stay ahead of the market with daily charts and insightful videos
-Your secret to strategic trading!

JOIN HERE


Welcome to TradingLounge (ASIC A.R.No. 321187), specialists in trades, trading education and technical analysis, covering stocks, indices, commodities, forex and cryptocurrencies.

When you join TradingLounge you have access to everything we offer, including trade tools, educational content and a social platform to chat with like-minded investors.

Read more

@Copyright 2024 by tradinglounge.com

Contact Us

Australian no: 02 4787 6020

International no: +61 (2) 47876020

Pay with:

Find us on