22May

Comprehensive Corn Price Analysis: Corn Commodity Elliott Wave Forecast and Technical Insights into Current Corn Futures Market Trends

Corn Commodity Elliott Wave Technical Analysis – Daily and H4 Chart Review

Corn Elliott Wave Analysis

Function – Counter-Trend

Mode – Correction

Structure – Flat pattern in wave ((2))

Position – Wave ((2))

Direction – Toward wave ((3))

Corn Price Action Overview

As of May 13, corn futures began a recovery phase, likely marking a counter-trend move in line with Elliott Wave principles. This corrective phase is anticipated to target the 426–386 price zone, countering the prior downward momentum seen from April’s peak. This rebound could represent the initial stage of a broader technical correction in the corn market.

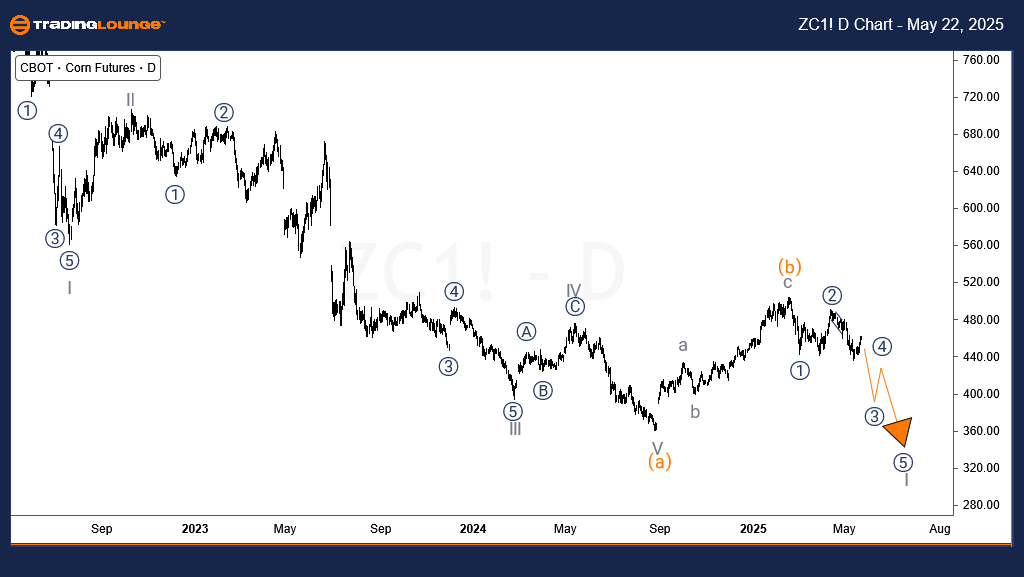
Corn Daily Chart Analysis

Since April 2022, corn prices have followed a clear downward trajectory, characterized by a series of lower highs and lows. This bearish trend culminated in August 2024, completing a full five-wave impulse decline. In alignment with Elliott Wave Theory, such impulsive trends are often succeeded by a three-wave corrective structure. The rally that started from the August 2024 low aligns with this corrective expectation.

By February 2025, the wave (b) correction, structured as a zigzag (highlighted in orange), was completed. The downward movement post-February might be developing another zigzag correction that may test the 426–386 area or could evolve into a new bearish impulse targeting sub-360 levels. This scenario would reinforce a negative outlook for corn prices in the medium term.

Corn-Commodity-ZC1-D...


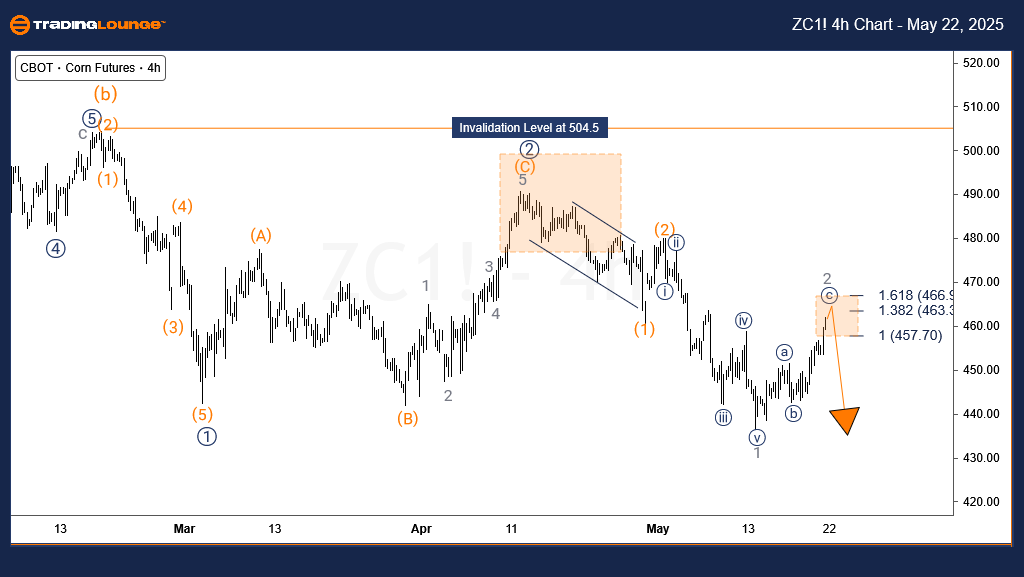
Corn H4 Chart Analysis

The 4-hour chart reflects the completion of waves ((1)) and ((2)) during March and April 2025. From mid-April, corn futures began to drop in a strong bearish wave 1 of (1) of ((3)). This initial impulsive leg was followed by a retracement move, which is forming as wave 2 of (1).

Wave 2 is projected to terminate within the 457–467 resistance range. After its completion, further downside pressure is expected, likely dragging prices back to the 400 level. This forecast supports the broader wave ((3)) decline as part of a continued bearish Elliott Wave forecast in corn futures.

Technical Analyst: Sanmi Adeagbo

Source: Visit Tradinglounge.com and learn from the Experts. Join TradingLounge Here 

See Previous: GX Uranium ETF (URA) Elliott Wave Technical Analysis

VALUE Offer - Buy 1 Month & Get 3 Months!Click here

Access 7 Analysts Over 200 Markets Covered. Chat Room With Support

Corn-Commodity-ZC1-4...

Related

AAVEUSD Elliott Wave Analysis: Potential Reversal Signals on Daily and 4H Charts - February 8, 2024

AAVEUSD Elliott Wave Analysis: Potential Reversal Signals on Daily and 4H Charts - February 8, 2024

In this comprehensive analysis of AAVEUSD's Elliott Wave patterns on both daily and 4-hour chart...

Read More >
Elliott Wave Analysis Guide: Mastering Stock Market Trends in S&P 500, NASDAQ 100, RUSSELL 2000, DAX 40, FTSE 100, ASX 200

Elliott Wave Analysis Guide: Mastering Stock Market Trends in S&P 500, NASDAQ 100, RUSSELL 2000, DAX 40, FTSE 100, ASX 200

The latest Elliott Wave Analysis suggests a strategic approach to trading in the upcoming Friday'...

Read More >
CAC 40 (France) Elliott Wave Technical Analysis - Market Trends, Price Predictions & Trading Strategies Based on Elliott Wave Theory

CAC 40 (France) Elliott Wave Technical Analysis - Market Trends, Price Predictions & Trading Strategies Based on Elliott Wave Theory

The CAC 40 Elliott Wave Analysis provides a detailed outlook on the French stock market trends based...

Read More >
Lululemon Athletica Inc. (LULU) Elliott Wave Analysis: Stock Forecast and Trading Opportunities with Key Support & Resistance Levels

Lululemon Athletica Inc. (LULU) Elliott Wave Analysis: Stock Forecast and Trading Opportunities with Key Support & Resistance Levels

Lululemon stock analysis provides an in-depth LULU Elliott Wave forecast, identifying key price move...

Read More >
SuperMicro Computers Inc. (SMCI) Stock Elliott Wave Analysis Shows Corrective Pattern Nearing Resistance with Short-Term Upside

SuperMicro Computers Inc. (SMCI) Stock Elliott Wave Analysis Shows Corrective Pattern Nearing Resistance with Short-Term Upside

SMCI’s corrective wave structure on both daily and hourly charts, highlighting short-term upside an...

Read More >
SuperMicro Computers Inc. (SMCI) Elliott Wave Forecast: Final Wave {v} & $50 Breakout Setup for Bullish SuperMicro Stock Trend Return

SuperMicro Computers Inc. (SMCI) Elliott Wave Forecast: Final Wave {v} & $50 Breakout Setup for Bullish SuperMicro Stock Trend Return

SMCI Elliott Wave analysis shows SuperMicro nearing completion of corrective flat on daily chart (wa...

Read More >

$1 for 2 Weeks

then $29 a month!

What a Special Offer!

Trade Recommendations

Unleash the power of deversified trading with our comprehensive portfolio, covering 250+ markets:

  • Stock Trades
  • Crypto Trades
  • Forex Trades
  • Commodity Trades
Elliott Wave Analysis

Gain a competitive edge with expert insights and AI-powered Elliott Wave charting into:

  • Global Indices
  • US Stocks & ASX Stocks
  • Forex & Crypto
  • Commodities
Top-Notch Trading Tools

Equip yourself with the tools of success:

  • Real-time Chat rooms
  • Elliott Wave Algorithm
  • Portfolio tools
  • TradingLevels
  • Screener
  • Trading Game
7 Elliott Wave Analysts

Stay ahead of the market with daily charts and insightful videos
Your secret to strategic trading!

JOIN HERE


Welcome to TradingLounge (ASIC A.R.No. 321187), specialists in trades, trading education and technical analysis, covering stocks, indices, commodities, forex and cryptocurrencies.

When you join TradingLounge you have access to everything we offer, including trade tools, educational content and a social platform to chat with like-minded investors.

Read more

@Copyright 2024 by tradinglounge.com

Contact Us

Australian no: 02 4787 6020

International no: +61 (2) 47876020

Pay with:

Find us on