GX Uranium ETF (URA) Technical Forecast – May 2025
The GX Uranium ETF (URA) is progressing within a bullish impulsive Elliott Wave structure from the April 2025 low. This advance potentially marks the end of the corrective phase that began in October 2024. If this shift confirms, it could resume the broader bullish trend that started in March 2020. Short-term bullish setups are anticipated as investors seek to buy on dips.
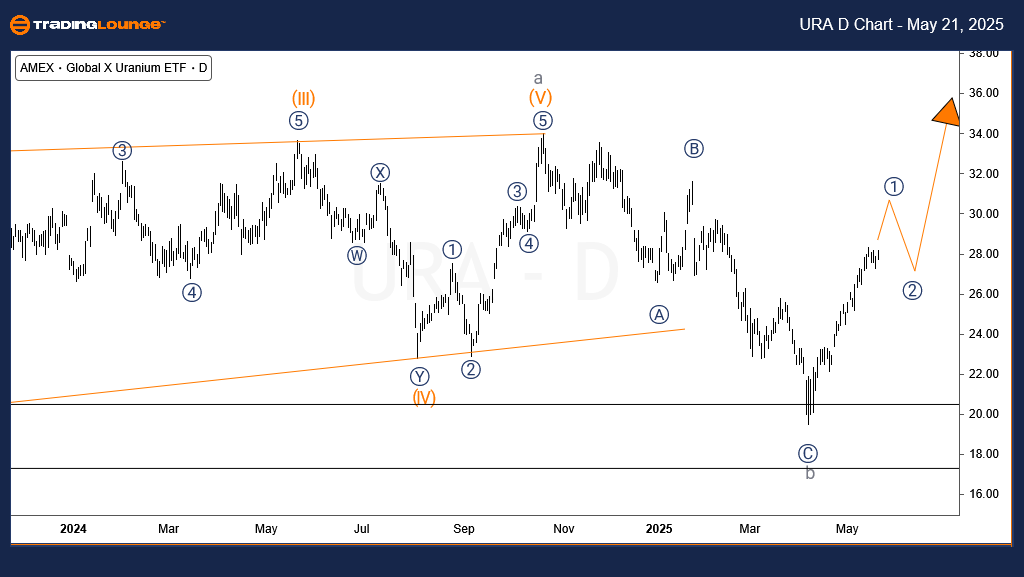
Daily Chart – GX URA Elliott Wave Technical Analysis
Analysis of the daily URA chart shows that a corrective zigzag pattern ended on April 8, 2025. This move completed the wave b of the cycle degree, concluding the retracement phase. It followed a 5-wave diagonal labeled wave a, which extended from March 2020 through October 2024. The ongoing rise from April indicates the formation of wave ((1)) of wave c within the same degree.
A pullback for wave ((2)) seems likely in the short term. However, as long as URA remains above the key $19.50 support level, this retracement could offer favorable long entry points in alignment with the overall bullish Elliott Wave scenario.
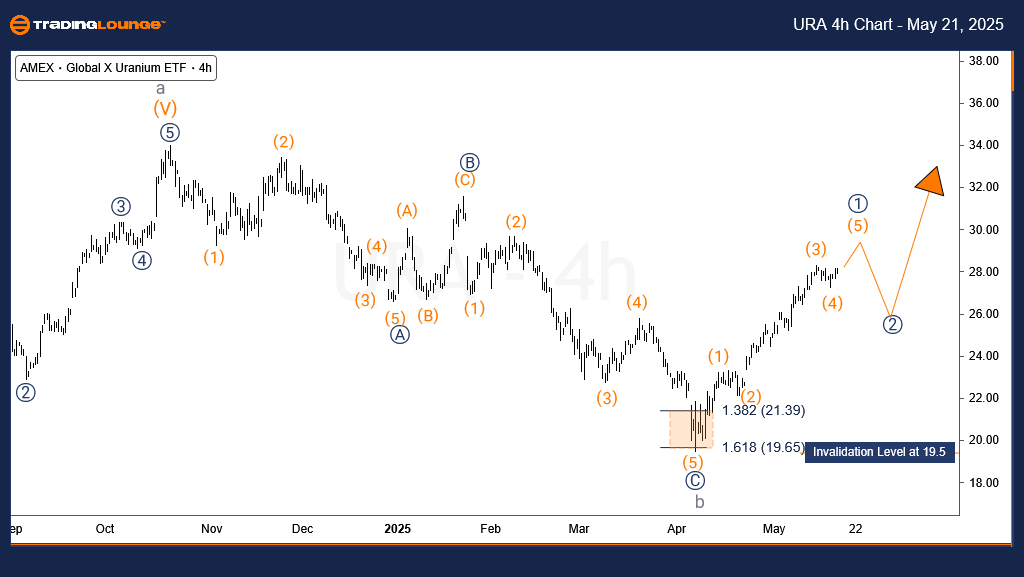
H4 Chart – GX URA Elliott Wave Technical Analysis
The 4-hour chart tracks the internal waves of wave ((1)), where waves (1) through (4) appear complete. Current price action suggests wave (5) is unfolding or close to finalizing. There is room for the bullish trend to reach as high as $30.65, although a reversal ahead of this target cannot be ruled out.
Traders should wait for the development of wave ((2)) before initiating long positions. The $19.50 low continues to serve as the invalidation level for the ongoing bullish Elliott Wave pattern.
Technical Analyst: Sanmi Adeagbo
Source: Visit Tradinglounge.com and learn from the Experts. Join TradingLounge Here
See Previous: Wheat Elliott Wave Technical Analysis
VALUE Offer - Buy 1 Month & Get 3 Months!Click here
Access 7 Analysts Over 200 Markets Covered. Chat Room With Support