04Apr

Sun Pharmaceutical Stock Analysis Using Elliott Wave: Bullish Trend, Trading Strategy, Price Target & Market Forecast

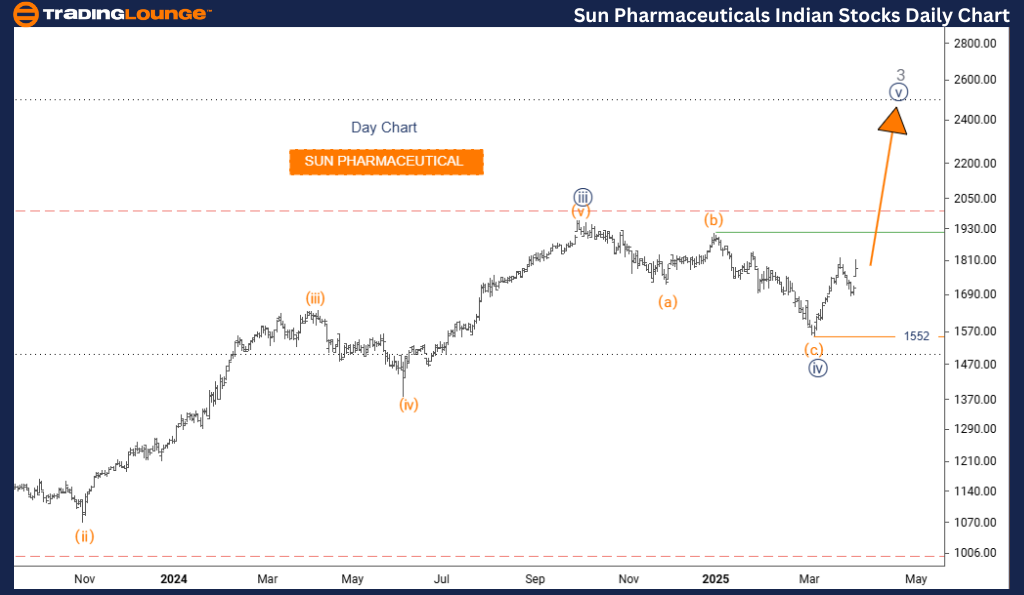
SUN PHARMACEUTICAL Elliott Wave Analysis – TradingLounge Daily Chart

SUN PHARMACEUTICAL Daily Chart Analysis

SUN PHARMACEUTICAL Elliott Wave Technical Analysis

Technical Overview

  • Function: Uptrend Continuation
  • Wave Mode: Impulsive Structure
  • Current Pattern: Navy Blue Wave 5
  • Wave Position: Gray Wave 3
  • Anticipated Direction (Lower Degree): Gray Wave 4
  • Critical Invalidation Level: 1552

SUNPHARMA Analysis Summary
The daily Elliott Wave analysis for SUN PHARMACEUTICAL highlights a strong bullish market structure, nearing its final stage. The current focus is on the development of navy blue wave 5, which forms the last component of the broader gray wave 3 trend cycle.

With navy blue wave 4 completed, the stock has entered its last impulsive segment, confirming the maturity of the ongoing uptrend that began from gray wave 1. This signals a potential short-term upside before a corrective phase.

SUNPHARMA Technical Outlook
The key support level stands at 1552—a breach of this would invalidate the active Elliott Wave count. So long as prices remain above this threshold, the bullish scenario is considered intact.

Post the completion of navy blue wave 5, a pullback into gray wave 4 is likely. This correction could offer traders a strategic entry before another potential bullish leg unfolds.

SUNPHARMA Trading Strategy
Traders should be alert for typical fifth wave characteristics, such as momentum divergence or slowing volume, which often precede market reversals. Although the trend supports holding long positions, caution is essential as the final wave advances.

This stage might be one of the last favorable opportunities to trade the current uptrend in SUN PHARMACEUTICAL stock, based on Elliott Wave forecasting.

SUN-PHARMACEUTICAL-i...


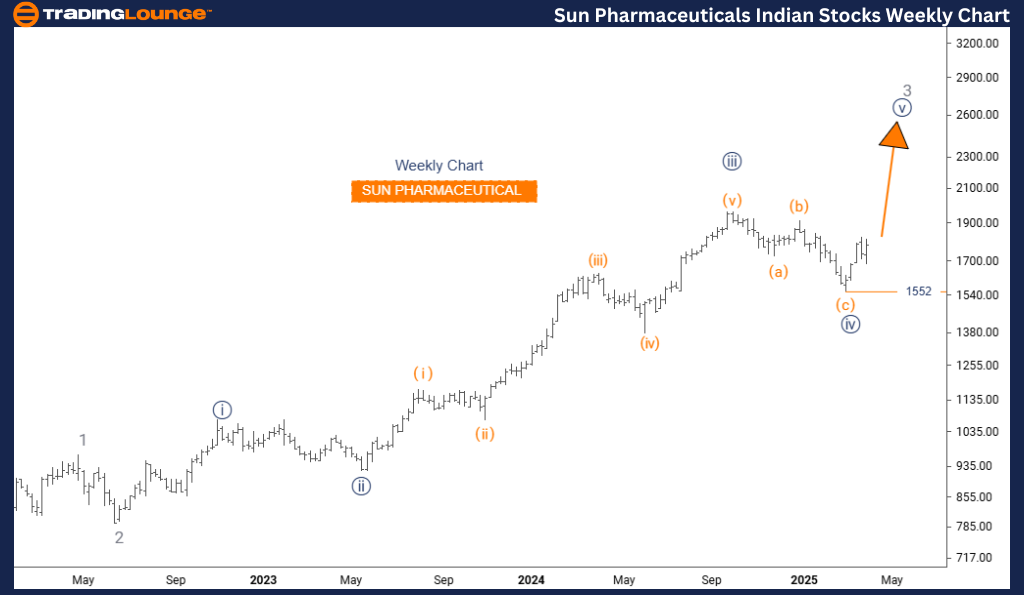
SUN PHARMACEUTICAL Elliott Wave Analysis – TradingLounge Weekly Chart

SUN PHARMACEUTICAL Elliott Wave Technical Analysis

SUNPHARMA Technical Overview

  • Function: Uptrend Continuation
  • Wave Mode: Impulsive Structure
  • Current Pattern: Navy Blue Wave 5
  • Wave Position: Gray Wave 3
  • Anticipated Direction (Lower Degree): Gray Wave 4
  • Critical Invalidation Level: 1552

SUNPHARMA Analysis Summary
The weekly Elliott Wave chart for SUN PHARMACEUTICAL maintains a bullish outlook, identifying the final impulse wave in an extended upward trend. The analysis is focused on navy blue wave 5, part of the larger gray wave 3 formation.

With navy blue wave 4 now complete, the market has entered navy blue wave 5, potentially marking the end of a significant bullish cycle that started with gray wave 1.

SUNPHARMA Technical Outlook
The invalidation level is firmly set at 1552. A drop below this value would disrupt the current wave structure. Until then, navy blue wave 5 remains dominant, indicating further upside momentum.

Following the conclusion of this wave, a corrective move into gray wave 4 is anticipated. This phase could transition the market into a consolidation or reversal zone.

SUNPHARMA Trading Strategy
Wave 5 phases are typically associated with the final leg of an uptrend, making it essential to watch for signals like momentum divergence or reduced buying pressure. While the bullish bias remains valid, risk management becomes increasingly important at this stage.

This current wave setup provides a strategic opportunity for swing and position traders, while also suggesting preparation for possible trend exhaustion.

Technical Analyst: Malik Awais

Source: visit Tradinglounge.com and learn From the Experts Join TradingLounge Here 

Previous: EICHER MOTORS Elliott Wave Technical Analysis

VALUE Offer - Buy 1 Month & Get 3 Months!Click here

Access 7 Analysts Over 200 Markets Covered. Chat Room With Support

SUN-PHARMACEUTICAL-i...

Related

MicroStrategy Inc. (MSTR) Elliott Wave Analysis: Stock Price Prediction, Key Support and Resistance Levels, and Market Trends

MicroStrategy Inc. (MSTR) Elliott Wave Analysis: Stock Price Prediction, Key Support and Resistance Levels, and Market Trends

Elliott Wave analysis of MicroStrategy (MSTR) predicts a decline toward $213, with key support at $2...

Read More >
Hang Seng Index Elliott Wave Technical Analysis: We Cover everything you need Index Market Fund Analysis

Hang Seng Index Elliott Wave Technical Analysis: We Cover everything you need Index Market Fund Analysis

Our comprehensive guide on Hang Seng trading provides in-depth HSI analysis, market forecasts, and i...

Read More >
Asian Paints Stock Forecast Using Elliott Wave: Impulsive Rally Nearing Completion, Expect Reversal and Trading Opportunities Soon

Asian Paints Stock Forecast Using Elliott Wave: Impulsive Rally Nearing Completion, Expect Reversal and Trading Opportunities Soon

Asian Paints is advancing in an impulsive Elliott Wave structure, nearing the final leg of a counter...

Read More >
Capitalize on this with our Detailed Bitcoin Trading Strategy and Crypto Price News: BTCUSD Elliott Wave Technical Analysis

Capitalize on this with our Detailed Bitcoin Trading Strategy and Crypto Price News: BTCUSD Elliott Wave Technical Analysis

In this analysis, we dive deep into BTCUSD Elliott Wave trends to understand Bitcoin's price mov...

Read More >
Eaton Corp PLC Stocks Elliott Wave Technical Analysis: ETN Currently in an Impulsive Uptrend, Investors Can Gauge Upcoming Opportunities

Eaton Corp PLC Stocks Elliott Wave Technical Analysis: ETN Currently in an Impulsive Uptrend, Investors Can Gauge Upcoming Opportunities

This article provides a comprehensive Elliott Wave analysis of Eaton Corp PLC (ETN) using both daily...

Read More >
Nvidia Corporation (NVDA) Stock Analysis: NVDA Elliott Wave Forecast, Technical Outlook, and Trend Reversal Insights

Nvidia Corporation (NVDA) Stock Analysis: NVDA Elliott Wave Forecast, Technical Outlook, and Trend Reversal Insights

Elliott Wave analysis of NVIDIA Corp. (NVDA), highlighting corrective patterns on the daily and 1-ho...

Read More >

$1 for 2 Weeks

then $29 a month!

What a Special Offer!

Trade Recommendations

Unleash the power of deversified trading with our comprehensive portfolio, covering 250+ markets:

  • Stock Trades
  • Crypto Trades
  • Forex Trades
  • Commodity Trades
Elliott Wave Analysis

Gain a competitive edge with expert insights and AI-powered Elliott Wave charting into:

  • Global Indices
  • US Stocks & ASX Stocks
  • Forex & Crypto
  • Commodities
Top-Notch Trading Tools

Equip yourself with the tools of success:

  • Real-time Chat rooms
  • Elliott Wave Algorithm
  • Portfolio tools
  • TradingLevels
  • Screener
  • Trading Game
7 Elliott Wave Analysts

Stay ahead of the market with daily charts and insightful videos
Your secret to strategic trading!

JOIN HERE


Welcome to TradingLounge (ASIC A.R.No. 321187), specialists in trades, trading education and technical analysis, covering stocks, indices, commodities, forex and cryptocurrencies.

When you join TradingLounge you have access to everything we offer, including trade tools, educational content and a social platform to chat with like-minded investors.

Read more

@Copyright 2024 by tradinglounge.com

Contact Us

Australian no: 02 4787 6020

International no: +61 (2) 47876020

Pay with:

Find us on