Trading Lounge Vanguard: V300AEQ ETF UNITS – VAS Elliott Wave Analysis
Welcome to our latest Elliott Wave analysis update for the Australian Stock Exchange (ASX), focusing on V300AEQ ETF UNITS – VAS. Our technical analysis confirms the conclusion of wave 2-grey and indicates the commencement of wave 3-grey, suggesting a potential upward movement.
ASX: V300AEQ ETF UNITS – VAS Elliott Wave Technical Analysis
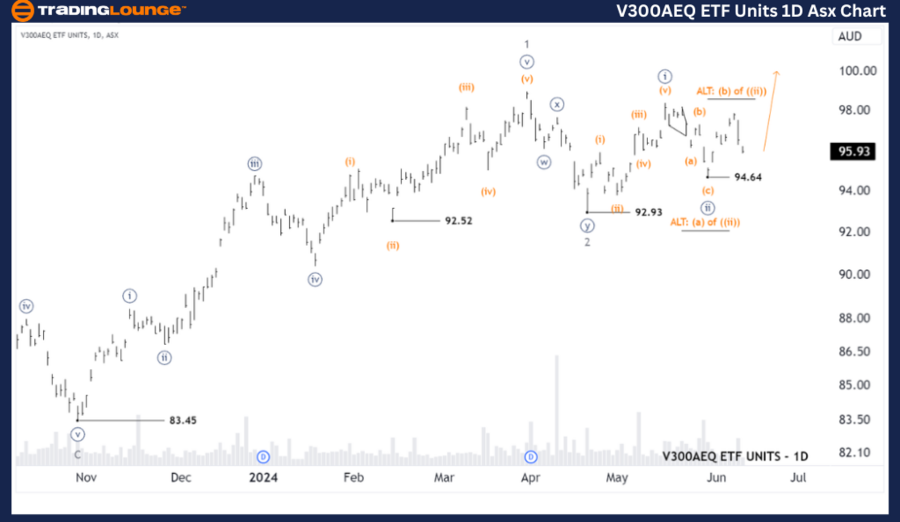
ASX: V300AEQ ETF UNITS – VAS 1D Chart (Semilog Scale)
Function: Major trend (Minor degree, grey)
Mode: Motive
Structure: Impulse
Position: Wave ((iii))-navy of Wave 3-grey
Details: Our short-term outlook reveals that wave ((ii))-navy has concluded, and wave ((iii))-navy is poised to advance. To maintain this bullish perspective, the price must remain above 94.64.
Invalidation Point: 94.64

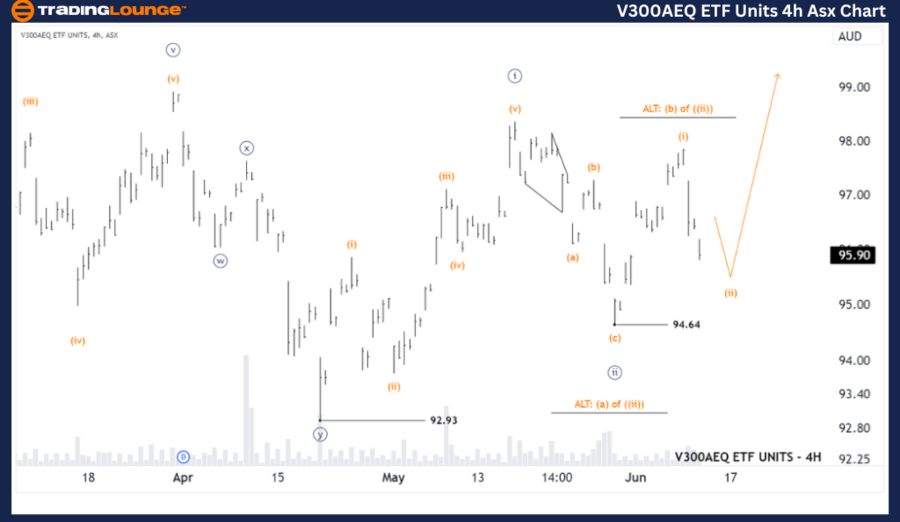
ASX: V300AEQ ETF UNITS – VAS 4-Hour Chart Analysis
Function: Major trend (Minute degree, navy)
Mode: Motive
Structure: Impulse
Position: Wave (ii)-orange of Wave ((iii))-navy
Details: In the shorter term, wave ((i))-navy ended at 94.64, and wave ((iii))-navy is developing. This development includes wave (i)-orange, which has concluded, setting the stage for wave (ii)-orange to potentially push lower before wave (iii)-orange continues the upward trend.
Invalidation Point: 94.64
Technical Analyst: Hua (Shane) Cuong, CEWA-M (Master’s Designation).
Source: visit Tradinglounge.com and learn From the Experts Join TradingLounge Here
Previous: BRAMBLES LIMITED - BXB Elliott Wave Technical Analysis
Special Trial Offer - 0.76 Cents a Day for 3 Months! Click here
Access 7 Analysts Over 170 Markets Covered. Chat Room With Support

Conclusion
Our Elliott Wave analysis provides insights into the current market trends for ASX: V300AEQ ETF UNITS – VAS. By identifying key price points that serve as validation or invalidation signals for our wave counts, we aim to enhance confidence in our market perspective. Our objective analysis offers readers a professional and strategic approach to capitalizing on market movements.