ASX: NAB Elliott Wave Technical Analysis – Daily Chart (Semilog Scale)
Function: Primary Trend (Intermediate Degree – Orange)
Wave Mode: Motive
Wave Structure: Impulse
Current Position: Wave (3) – Orange
Analysis Details:
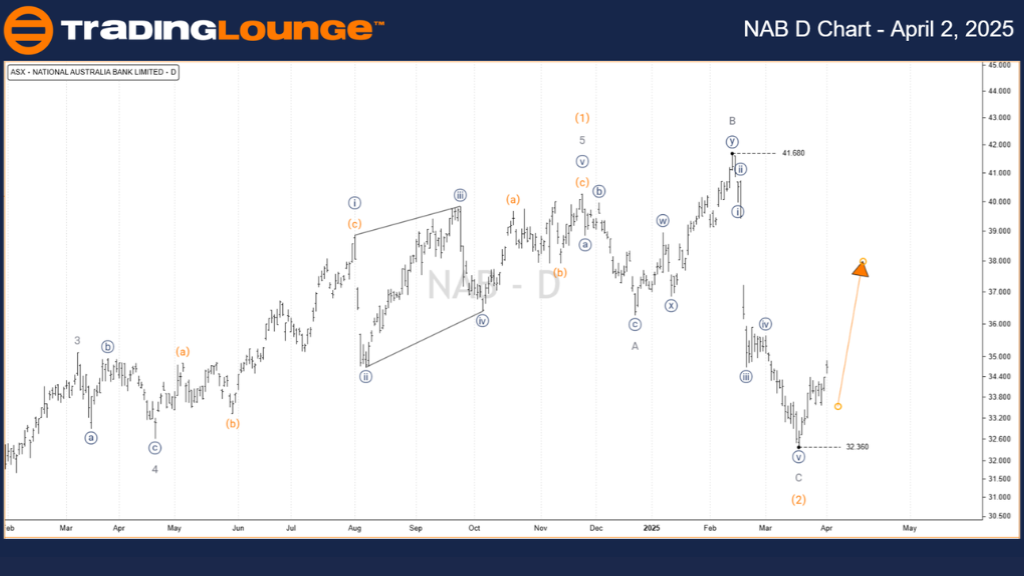
The corrective Wave (2) – Orange may have completed at 32.360, forming an Expanded Flat correction labeled A-B-C – Grey. Wave C – Grey illustrates a clear five-wave move, supporting the idea that Wave (3) – Orange is currently in progress with upward momentum.
Key Invalidation Level: 32.360

ASX: NAB Elliott Wave Technical Analysis – 4-Hour Chart
Function: Primary Trend (Minor Degree – Grey)
Wave Mode: Motive
Wave Structure: Impulse
Current Position: Wave ((iii)) – Navy within Wave (3) – Orange
Analysis Details:
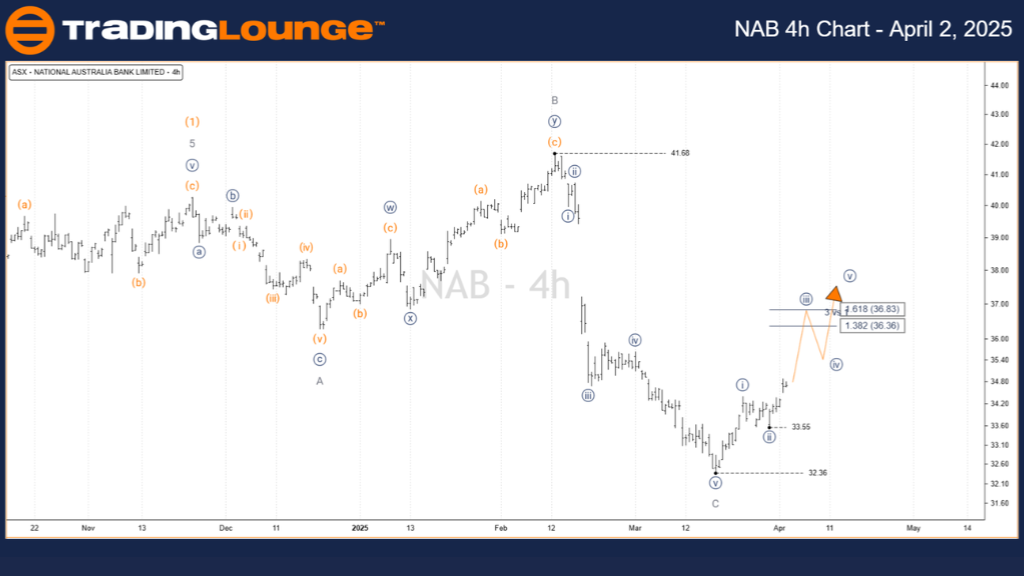
From the low at 32.360, Wave (3) – Orange appears to be developing, with subdivisions visible in Wave ((i)) – Navy and Wave ((ii)) – Navy, both likely complete. Wave ((iii)) – Navy is currently unfolding, with an anticipated upward target near 36.83.
Key Invalidation Level: 132.76
Technical Analyst: Hua (Shane) Cuong, CEWA-M (Master’s Designation).
Source: Visit Tradinglounge.com and learn from the Experts. Join TradingLounge Here
See Previous: CAR GROUP LIMITED – CAR Elliott Wave Technical Analysis
VALUE Offer - Buy 1 Month & Get 3 Months!Click here
Access 7 Analysts Over 200 Markets Covered. Chat Room With Support

Conclusion
This Elliott Wave forecast for ASX: NATIONAL AUSTRALIA BANK LIMITED (NAB) offers a technical viewpoint on short-term and intermediate price movement. The identified support and resistance levels act as validation and invalidation points to enhance the credibility of the wave count. This analysis provides a strategic framework for traders to make more informed decisions based on wave structure and market behavior.