Polkadot (DOT/USD) continues to intrigue traders with its dynamic price movements and patterns that often adhere to the Elliott Wave principles. This analysis will explore the technical aspects of DOT/USD trading patterns on both the daily and H4 charts, providing insights into potential future movements and strategic trading decisions.

TradingLounge Elliott Wave Analysis of Polkadot (DOT/USD): Daily Chart

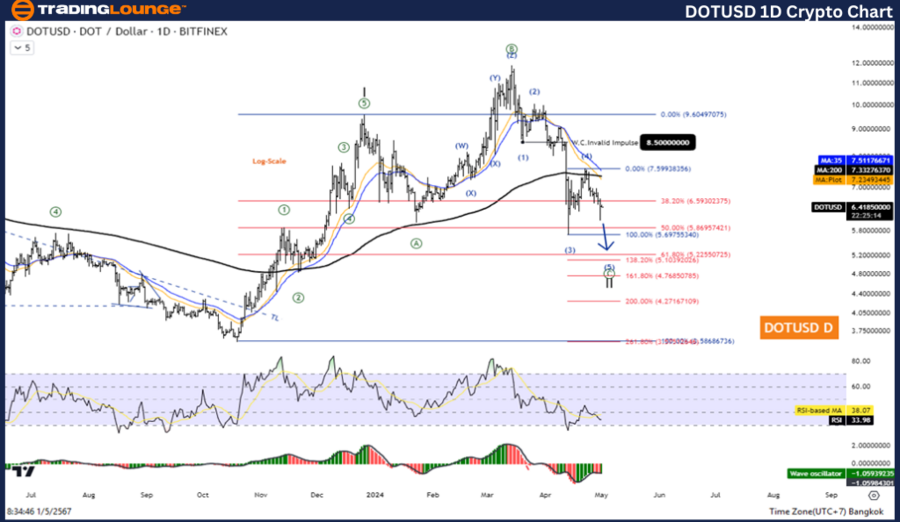
The Elliott Wave Technical Analysis on the daily chart for Polkadot against the U.S. dollar (DOT/USD) showcases a counter-trend structure with a flat correction pattern that is currently positioned in Wave C.

Pokadot/ U.S. dollar(DOTUSD) Daily Chart Analysis

DOTUSD Elliott Wave Technical Analysis

Function: Counter Trend

Mode: Corrective

Structure: Flat

Position: Wave C

Direction Next higher Degrees: wave (II) of Impulse

Wave Cancel invalid level:

Details: Wave II Is equal to  61.8% of  Wave I at 5.225

Pokadot/ U.S. dollar(DOTUSD)Trading Strategy:
Second wave correction before rising again in the third wave with a flat pattern. The current status is a short-term pullback in wave B before falling again in wave C, so wait for the correction to complete to join the uptrend again.

Pokadot/ U.S. dollar(DOTUSD)Technical Indicators: The price is above the MA200 indicating an Uptrend, The Wave Oscillator is a Bullish Momentum.
DOTUSD-1D-Crypto-Cha...


TradingLounge Elliott Wave Analysis of Polkadot (DOT/USD): 4-Hour Chart

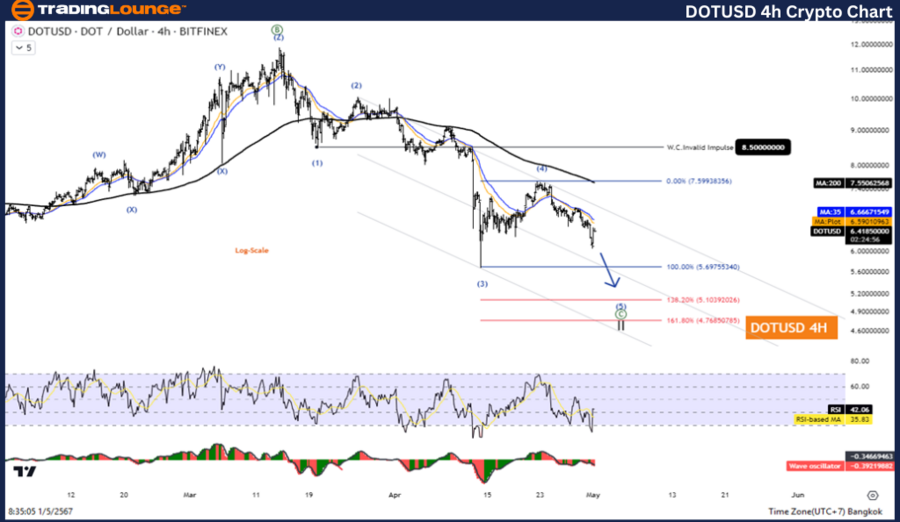
On the H4 chart, Polkadot's market behaviour aligns with a follow-trend function, characterized by a motive structure. This indicates a more aggressive trading pattern, typically associated with significant price movements.

Pokadot/ U.S. dollar(DOTUSD) 4-hour Chart Analysis

DOTUSD Elliott Wave Technical Analysis

Function: Follow  Trend

Mode: Motive

Structure: Impulse

Position: Wave 4

Direction Next higher Degrees: wave C of Flat

Wave Cancel invalid level:

Details: A short-term pullback in wave 4 before falling again in wave 5.

Pokadot/ U.S. dollar(DOTUSD)Trading Strategy:
Second wave correction before rising again in the third wave with a flat pattern. The current status is a short-term pullback in wave B before falling again in wave C, so wait for the correction to complete to join the uptrend again.

Pokadot/ U.S. dollar(DOTUSD)Technical Indicators: The price is above the MA200 indicating an uptrend, The Wave Oscillator is a Bullish Momentum.

Technical Analyst: Kittiampon Somboonsod

Source: visit Tradinglounge.com and learn From the Experts Join TradingLounge Here 

Previous: Elliott Wave Technical Analysis of NEO/USD

Special Trial Offer - 0.76 Cents a Day for 3 Months! Click here

Access 6 Analysts covering over 150 Markets. Chat Room With Support

DOTUSD-4H-Crypto-Cha...

Conclusion and Trading Tips

Both the daily and H4 charts for Polkadot (DOT/USD) indicate bullish momentum with ongoing corrections that offer strategic entry points for traders. By applying Elliott Wave Analysis, traders can better anticipate price movements and optimize their trading strategies accordingly.

Related

Eli Lilly & Co.(LLY:NYSE) Elliott Wave Technical Analysis 28 November 23

Eli Lilly & Co.(LLY:NYSE) Elliott Wave Technical Analysis 28 November 23

Eli Lilly & Co.(LLY:NYSE) Elliott Wave Technical Analysis dated 28 November 23 with 1-hour and 4-hou...

Read More >
Elliott Wave Trading Strategies for SP500, NASDAQ 100 & Leading Tech Stocks

Elliott Wave Trading Strategies for SP500, NASDAQ 100 & Leading Tech Stocks

Elliott Wave analysis shows major indices and leading tech stocks in corrective Wave (4), setting up...

Read More >
Euro/U.S.Dollar(EURUSD) Forex Elliott Wave Technical Analysis: A Comprehensive Trading Guide

Euro/U.S.Dollar(EURUSD) Forex Elliott Wave Technical Analysis: A Comprehensive Trading Guide

This guide offers a detailed examination of EURUSD Elliott Wave analysis across both daily and 4-hou...

Read More >
Detailed USDCAD Elliott Wave Analysis: Chart Insights, Corrective and Impulsive Waves, Forex Strategies, and Predictions

Detailed USDCAD Elliott Wave Analysis: Chart Insights, Corrective and Impulsive Waves, Forex Strategies, and Predictions

This article offers a comprehensive USDCAD Elliott Wave Analysis, covering both day and 4-hour chart...

Read More >
British Pound/Japanese Yen(GBPJPY) Elliott Wave Technical Analysis 5 December 23

British Pound/Japanese Yen(GBPJPY) Elliott Wave Technical Analysis 5 December 23

GBPJPY Elliott Wave Analysis Trading Lounge Day Chart for 5 December 23, delves into the technical a...

Read More >
Comprehensive Elliott Wave Analysis for Leading NASDAQ Tech Stocks and S&P 500

Comprehensive Elliott Wave Analysis for Leading NASDAQ Tech Stocks and S&P 500

tay ahead in the financial markets with our expert Elliott Wave Analysis tailored for NASDAQ Tech St...

Read More >

$1 for 2 Weeks

then $29 a month!

What a Special Offer!

Trade Recommendations

Unleash the power of deversified trading with our comprehensive portfolio, covering 250+ markets:

  • Stock Trades
  • Crypto Trades
  • Forex Trades
  • Commodity Trades
Elliott Wave Analysis

Gain a competitive edge with expert insights and AI-powered Elliott Wave charting into:

  • Global Indices
  • US Stocks & ASX Stocks
  • Forex & Crypto
  • Commodities
Top-Notch Trading Tools

Equip yourself with the tools of success:

  • Real-time Chat rooms
  • Elliott Wave Algorithm
  • Portfolio tools
  • TradingLevels
  • Screener
  • Trading Game
7 Elliott Wave Analysts

Stay ahead of the market with daily charts and insightful videos
Your secret to strategic trading!

JOIN HERE


Welcome to TradingLounge (ASIC A.R.No. 321187), specialists in trades, trading education and technical analysis, covering stocks, indices, commodities, forex and cryptocurrencies.

When you join TradingLounge you have access to everything we offer, including trade tools, educational content and a social platform to chat with like-minded investors.

Read more

@Copyright 2024 by tradinglounge.com

Contact Us

Australian no: 02 4787 6020

International no: +61 (2) 47876020

Pay with:

Find us on