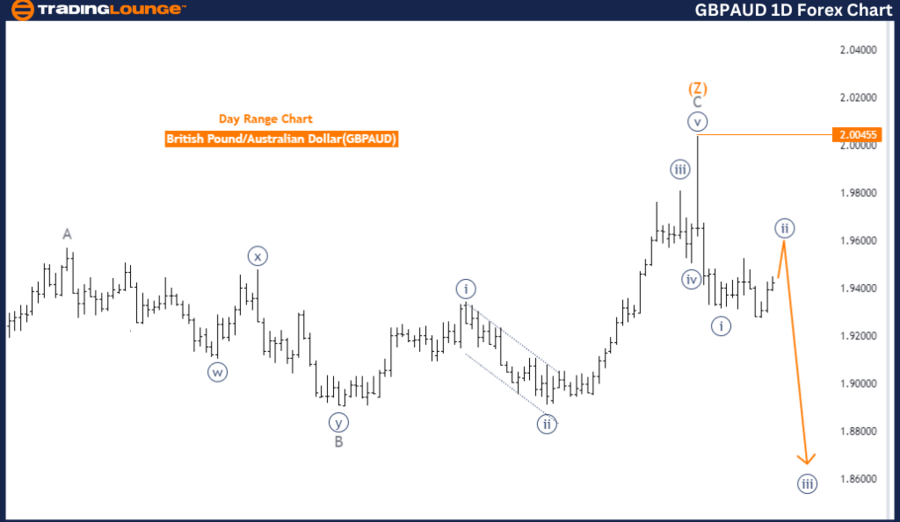
GBPAUD Elliott Wave Analysis TradingLounge Day Chart
British Pound/Australian Dollar - Day Chart Analysis
GBPAUD Elliott Wave Technical Analysis
- Function: Counter Trend
- Mode: Corrective
- Structure: Navy Blue Wave 2
- Position: Gray Wave 1
- Next Lower Degrees Direction: Navy Blue Wave 3
- Details: Navy Blue Wave 1 appears complete; Navy Blue Wave 2 is currently in play.
- Wave Cancel Invalid Level: 2.00455
The GBPAUD currency pair is currently in a corrective phase on the daily chart, as indicated by the Elliott Wave theory. This analysis highlights that the market is in a counter-trend mode, characterized by corrective patterns rather than impulsive movements.
The key structure under observation is Navy Blue Wave 2, signifying a retracement following the completion of Navy Blue Wave 1.
At this moment, the market is positioned in Gray Wave 1, which indicates the onset of a new corrective pattern. Navy Blue Wave 1, the previous impulsive movement, seems to have completed, and the market has now entered Navy Blue Wave 2. This wave, being corrective, generally moves against the prior trend, indicating a temporary retracement or consolidation phase.
The direction for the next lower degrees points toward the development of Navy Blue Wave 3, representing the next significant movement in the market once the current corrective phase concludes. Traders are closely monitoring this phase to determine when Wave 2 will finish, signaling a potential resumption of the broader trend with Wave 3.
A critical level to watch is 2.00455, identified as the wave cancel invalid level. If the market surpasses this threshold, it would invalidate the current wave count, suggesting that the expected corrective structure might not develop as anticipated. This level serves as a crucial point for confirming or disproving the validity of the present Elliott Wave structure.
Summary:
The GBPAUD pair is in a corrective phase on the daily chart, with Navy Blue Wave 2 currently unfolding after the completion of Navy Blue Wave 1. The market is anticipated to transition into Navy Blue Wave 3, but traders should keep a close watch on the 2.00455 level to validate or invalidate the ongoing wave analysis.
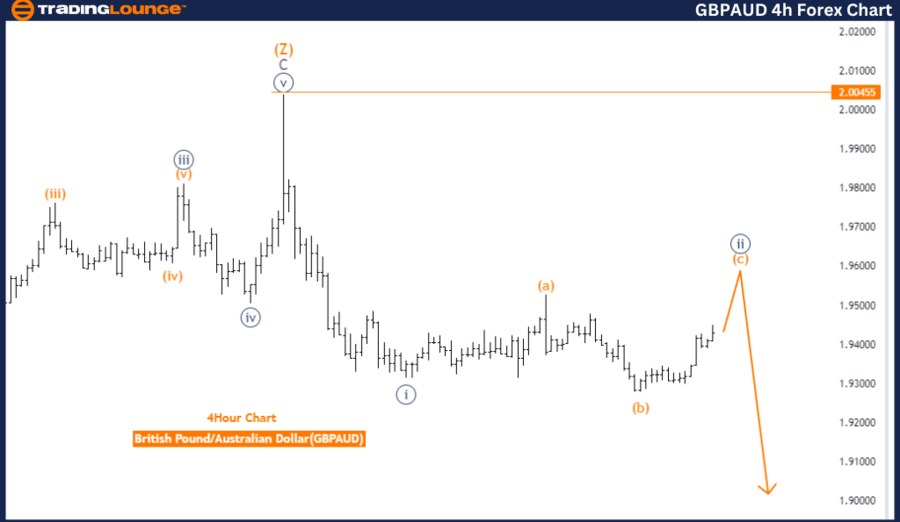
British Pound/Australian Dollar - 4 Hour Chart Analysis
GBPAUD Technical Analysis
- Function: Counter Trend
- Mode: Corrective
- Structure: Navy Blue Wave 2
- Position: Gray Wave 1
- Next Lower Degrees Direction: Navy Blue Wave 3
- Details: Navy Blue Wave 1 appears complete; Navy Blue Wave 2 is currently in play.
- Wave Cancel Invalid Level: 2.00455
The GBPAUD currency pair is currently being analyzed on the 4-hour chart using Elliott Wave theory. The analysis suggests that the market is in a counter-trend phase, operating in a corrective mode. The primary structure being observed is Navy Blue Wave 2, which is part of a larger corrective pattern.
At this time, the market is positioned within Gray Wave 1, indicating the initial stages of a potential new trend. However, due to the corrective nature of this phase, the market has not yet transitioned into a strong impulsive movement. Instead, it is in a phase where the previous impulsive move, identified as Navy Blue Wave 1, appears to have completed, and the market is now retracing in Navy Blue Wave 2.
Navy Blue Wave 2 is the focal point at this stage, representing a corrective wave that typically moves against the previous trend. This wave is part of a broader corrective pattern, suggesting that the market may experience some consolidation or retracement before potentially resuming a new trend.
The next direction for lower degrees indicates the development of Navy Blue Wave 3, which would signify the next impulsive move following the completion of the current corrective phase. Traders are closely monitoring this phase to determine when the corrective move will end and the market will resume its impulsive trend.
A crucial level to observe in this analysis is 2.00455, identified as the wave cancel invalid level. If the market exceeds this level, it would invalidate the current wave count, implying that the expected corrective structure may not develop as forecasted. This level acts as a key threshold for confirming the validity of the current Elliott Wave structure.
Summary:
The GBPAUD pair is currently in a corrective phase on the 4-hour chart, with Navy Blue Wave 2 unfolding following the completion of Navy Blue Wave 1. The market is expected to eventually move into Navy Blue Wave 3, but traders should monitor the 2.00455 level for potential shifts in the market structure.
Technical Analyst: Malik Awais
Source: visit Tradinglounge.com and learn From the Experts Join TradingLounge Here
Previous: USDJPY Elliott Wave Technical Analysis
Special Trial Offer - 0.76 Cents a Day for 3 Months! Click here
Access 7 Analysts Over 200 Markets Covered. Chat Room With Support