17Jul

Advanced Micro Devices Inc. AMD Elliott Wave Analysis Near $180 Resistance Highlights Wave (v) Top & Potential Correction Signals on Charts

AMD Elliott Wave Analysis – Trading Lounge  Daily Chart

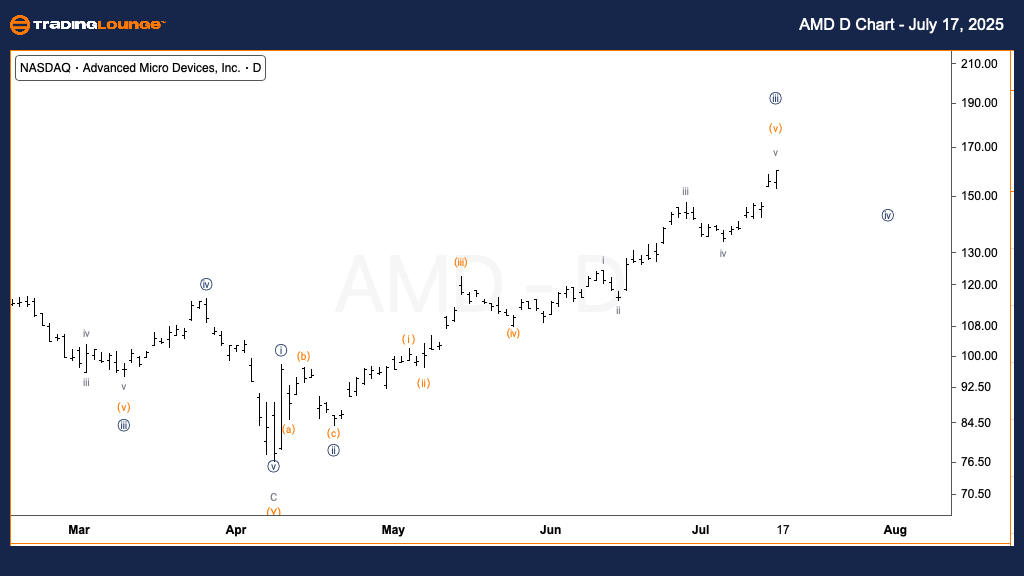
Advanced Micro Devices Inc. (AMD) Daily Chart Overview

AMD Elliott Wave Technical Overview

Function: Trend

Mode: Impulsive

Structure: Motive

Position: Wave (v) of {iii}

Direction: Possible Top in Wave (v)

Details: Price nearing Minor Group 2 zone around $180, signaling potential completion of wave {iii}.

On the daily timeframe, AMD stock is approaching the final phase of an impulsive Elliott Wave cycle. Currently, wave (v) of {iii} is developing, and price action is moving close to the key resistance level at $180, aligning with the end of Minor Group 2 in wave terms.

Though AMD maintains an upward trend, the proximity to this resistance level may indicate a short-term peak. A break or reversal around this zone would suggest wave {iii} has completed, initiating a corrective wave {iv} pullback. Traders are advised to watch for reversal signals near $180 to anticipate a shift in momentum.

AMD-D-Chart-170725


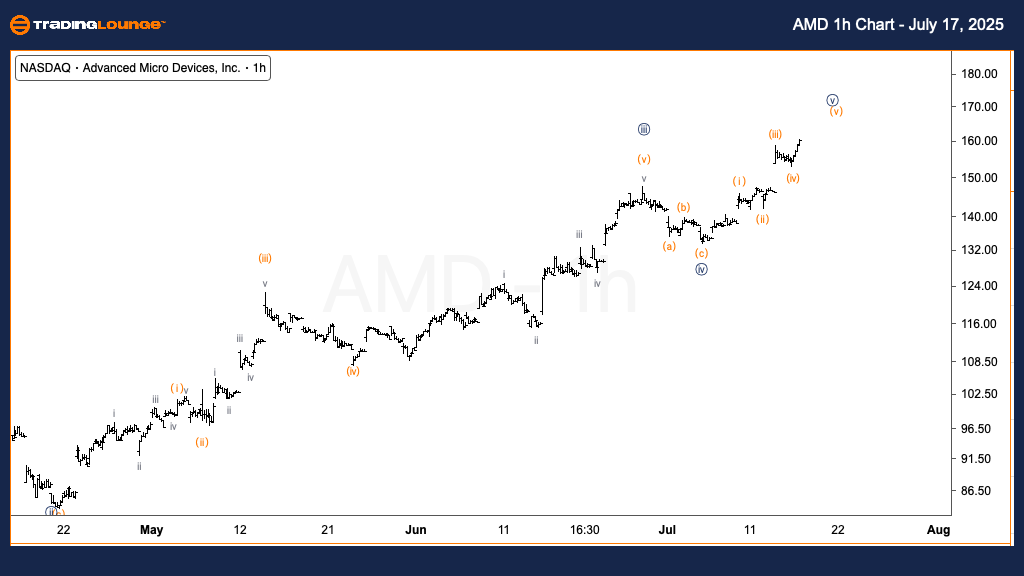
Advanced Micro Devices Inc. (AMD) US Stock 1H Chart Analysis

AMD Elliott Wave Technical Overview

Function: Trend

Mode: Impulsive

Structure: Motive

Position: Wave (V) of {v}

Direction: Potential Top in Wave (v)

Details: Conservative wave count indicates wave {v} of 1 is reaching final stages.

The hourly chart offers a detailed view of AMD’s shorter-term Elliott Wave formation. The stock is in the last leg of wave (V) within {v} of 1, suggesting that a near-term top could be forming soon.

This conservative count implies that once this last move concludes, wave 2 correction might begin. As the price closes in on the $180 resistance zone, traders should remain alert to any reversal signals, which could offer early insight into the start of a broader corrective phase.

Technical Analyst: Alessio Barretta

Source: Visit Tradinglounge.com and learn from the Experts. Join TradingLounge Here 

See Previous: MicroStrategy (MSTR) Elliott Wave Technical Analysis

VALUE Offer - $1 for 2 Weeks then $29 a month!Click here

Access 7 Analysts Over 200 Markets Covered. Chat Room With Support

AMD-1h-Chart-170725

Related

Cochlear Limited COH Elliott Wave Analysis Reveals Wave 3 Rally With $350 Target, $246.52 Invalidation & Medium‑Term Outlook

Cochlear Limited COH Elliott Wave Analysis Reveals Wave 3 Rally With $350 Target, $246.52 Invalidation & Medium‑Term Outlook

This Elliott Wave analysis shows Cochlear Limited (COH) has likely completed Wave 2 and begun a powe...

Read More >
NZDUSD Elliott Wave Analysis Reveals Strong Bullish Wave 3 Trend with Critical Invalidation Level and Multitimeframe Trading Setup

NZDUSD Elliott Wave Analysis Reveals Strong Bullish Wave 3 Trend with Critical Invalidation Level and Multitimeframe Trading Setup

This analysis provides a detailed NZDUSD Elliott Wave outlook, highlighting a bullish impulsive wave...

Read More >
U.S. Dollar / Japanese Yen (USDJPY) Elliott Wave Forecast: Daily & 4-Hour Bearish Trend Analysis, Wave 3 Formation

U.S. Dollar / Japanese Yen (USDJPY) Elliott Wave Forecast: Daily & 4-Hour Bearish Trend Analysis, Wave 3 Formation

USDJPY remains in a strong bearish trend according to Elliott Wave analysis, with active wave 3 form...

Read More >
Learn about the Polkadot Crypto Market Trends, and Trading Strategies with DOTUSD Elliott Wave Technical Analysis

Learn about the Polkadot Crypto Market Trends, and Trading Strategies with DOTUSD Elliott Wave Technical Analysis

Discover in-depth Polkadot (DOTUSD) Elliott Wave analysis and price predictions. Learn about the lat...

Read More >

$1 for 2 Weeks

then $29 a month!

What a Special Offer!

Trade Recommendations

Unleash the power of deversified trading with our comprehensive portfolio, covering 250+ markets:

  • Stock Trades
  • Crypto Trades
  • Forex Trades
  • Commodity Trades
Elliott Wave Analysis

Gain a competitive edge with expert insights and AI-powered Elliott Wave charting into:

  • Global Indices
  • US Stocks & ASX Stocks
  • Forex & Crypto
  • Commodities
Top-Notch Trading Tools

Equip yourself with the tools of success:

  • Real-time Chat rooms
  • Elliott Wave Algorithm
  • Portfolio tools
  • TradingLevels
  • Screener
  • Trading Game
7 Elliott Wave Analysts

Stay ahead of the market with daily charts and insightful videos
Your secret to strategic trading!

JOIN HERE


Welcome to TradingLounge (ASIC A.R.No. 321187), specialists in trades, trading education and technical analysis, covering stocks, indices, commodities, forex and cryptocurrencies.

When you join TradingLounge you have access to everything we offer, including trade tools, educational content and a social platform to chat with like-minded investors.

Read more

@Copyright 2024 by tradinglounge.com

Contact Us

Australian no: 02 4787 6020

International no: +61 (2) 47876020

Pay with:

Find us on