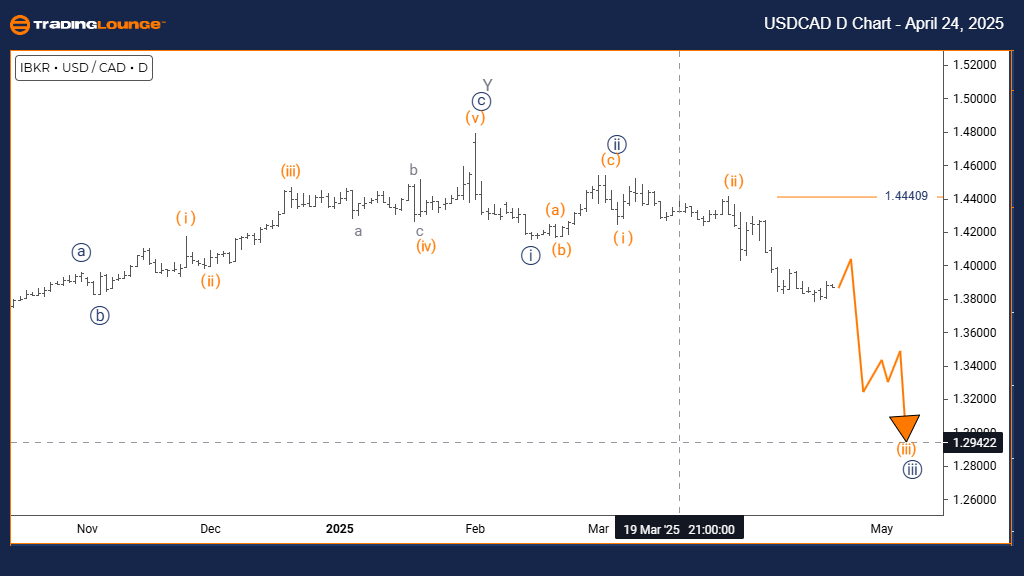
USDCAD Elliott Wave Forecast – TradingLounge Daily Chart
U.S. Dollar / Canadian Dollar (USDCAD) Daily Chart Analysis
USDCAD Elliott Wave Technical Analysis
FUNCTION: Bearish Trend
MODE: Impulsive
STRUCTURE: Orange Wave 3
POSITION: Navy Blue Wave 3
DIRECTION NEXT HIGHER DEGREES: Orange Wave 4
DETAILS: Completion of orange wave 2 confirmed; orange wave 3 now progressing.
WAVE INVALIDATION LEVEL: 1.44409
USDCAD is exhibiting a strong bearish impulse on the daily chart, aligning with a classic Elliott Wave structure. The completed correction of orange wave 2 signals the onset of orange wave 3, nested within a larger navy blue wave 3 – a setup that typically precedes significant downward momentum.
Wave 3 phases often demonstrate the highest velocity and extension in the Elliott Wave sequence. As such, the current progression of orange wave 3 suggests increased selling pressure and minimal retracements, consistent with impulsive wave behavior. Historically, wave 3 outpaces wave 1, both in length and strength, which supports a bearish continuation.
This chart configuration reinforces the broader downtrend, with potential for extended declines on higher timeframes. Traders should use the invalidation level at 1.44409 as a key technical benchmark—any breach would call for a reassessment of the current Elliott Wave count.
During this wave 3 phase, short-selling strategies are favored. Traders should look for confirming momentum indicators and trend strength tools. Once wave 3 concludes, an orange wave 4 correction may offer a short-term counter-trend opportunity before further downside unfolds.
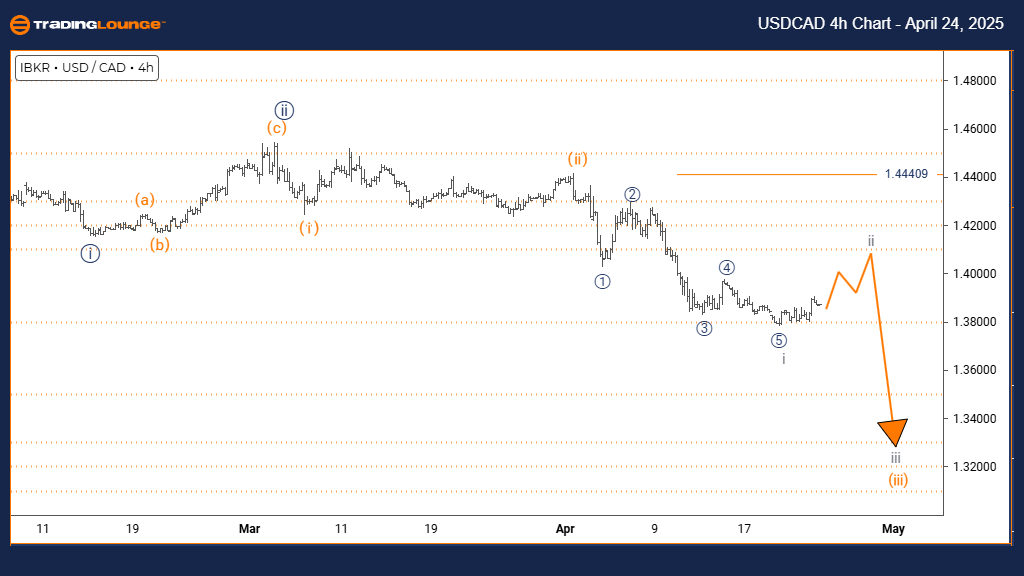
U.S. Dollar / Canadian Dollar (USDCAD) – 4-Hour Chart
USDCAD Elliott Wave Analysis – 4-Hour Timeframe
FUNCTION: Counter Trend
MODE: Corrective
STRUCTURE: Gray Wave 2
POSITION: Within Orange Wave 3
DIRECTION NEXT LOWER DEGREES: Gray Wave 3
DETAILS: Gray wave 1 is complete; gray wave 2 is currently in progress.
WAVE INVALIDATION LEVEL: 1.44409
On the 4-hour chart, USDCAD presents a short-term counter-trend correction as gray wave 2 develops within the dominant orange wave 3 downtrend. Following the completion of gray wave 1, the pair is retracing higher, exhibiting typical characteristics of a corrective wave—overlapping structure and subdued momentum.
Gray wave 2 is likely retracing 38% to 61% of gray wave 1’s move, aligning with common Fibonacci retracement zones. This phase serves as a pause in the overall bearish structure, providing a short-term pullback before the expected continuation lower via gray wave 3.
The upcoming wave 3 of gray degree should initiate a strong decline, likely exceeding the low of gray wave 1. The invalidation point remains at 1.44409—any break above this level invalidates the current wave count and trend assumptions.
Traders should monitor for reversal signals within gray wave 2, including bearish candlestick patterns and overbought momentum indicators. These signals can offer strategic short-entry setups ahead of the impulsive wave 3 decline.
This corrective movement is a natural breather in the broader downtrend. It allows market participants to align with the larger bearish structure, using Fibonacci tools and technical confluence to prepare for the next high-probability move.
Technical Analyst: Malik Awais
Source: Visit Tradinglounge.com and learn from the Experts. Join TradingLounge Here
Previous: USDJPY Elliott Wave Technical Analysis
VALUE Offer - Buy 1 Month & Get 3 Months!Click here
Access 7 Analysts Over 200 Markets Covered. Chat Room With Support