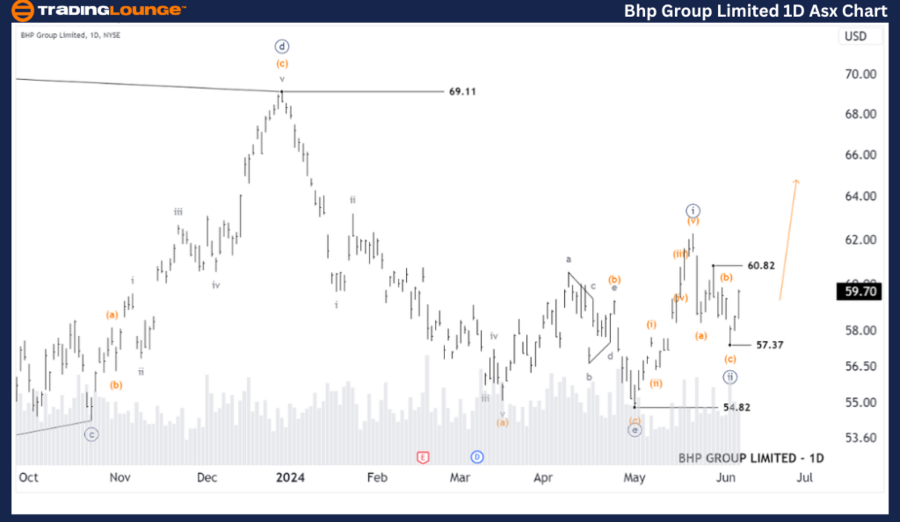
ASX: BHP GROUP LIMITED - BHP Elliott Wave Technical Analysis TradingLounge (1D Chart)

Greetings, Our Elliott Wave analysis today updates the Australian Stock Exchange (ASX) with BHP GROUP LIMITED - BHP. Since the 54.82 low, a Five-waves pattern appears to be unfolding, indicating higher potential. Waves ((i)) and ((ii))-navy seem complete, setting the stage for wave ((iii))-navy to push even higher.

ASX: BHP GROUP LIMITED - BHP Elliott Wave Technical Analysis

ASX: BHP GROUP LIMITED - BHP 1D Chart (Semilog Scale) Analysis

Function: Major (Minute degree, navy)

Mode: Motive

Structure: Impulse

Position: Wave ((iii))-navy

Details: The short-term outlook suggests that wave ((ii))-navy has ended. For confirmation, the price needs to rise above 60.82. If confirmed, wave ((iii))-navy will continue to push higher. The price must stay above 57.37 to maintain this outlook.

Confirmation point: 60.82

Invalidation point: 57.37

Bhp-Group-Ltd-1D-Asx...


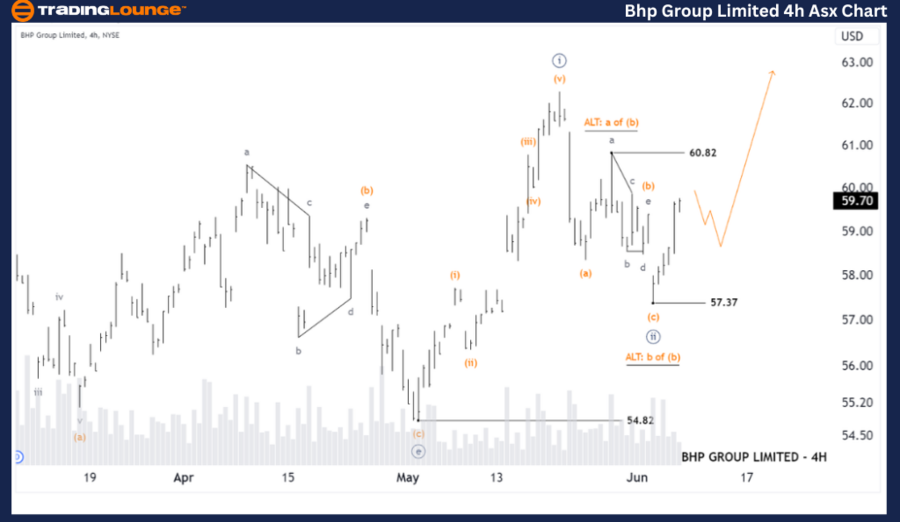
ASX: BHP GROUP LIMITED - BHP Elliott Wave Technical Analysis TradingLounge (4-Hour Chart)

ASX: BHP GROUP LIMITED - BHP Elliott Wave Technical Analysis

ASX: BHP GROUP LIMITED - BHP 4-Hour Chart Analysis

Function: Major trend (Minute degree, navy)

Mode: Motive

Structure: Impulse

Position: Wave ((3))-navy

Details: The short-term outlook indicates that wave ((ii))-navy may have ended as a Zigzag. Starting from the 57.37 low, wave ((iii))-navy is likely unfolding to push higher. Be aware of the alternative wave count (ALT), suggesting wave (b)-orange of wave ((ii))-navy might still be unfolding, though this scenario is less probable.

Confirmation point: 60.82

Invalidation point: 57.37

Technical Analyst: Hua (Shane) Cuong, CEWA-M (Master’s Designation).

Source: visit Tradinglounge.com and learn From the Experts Join TradingLounge Here 

Previous: ASX LIMITED - ASX Elliott Wave Technical Analysis

Special Trial Offer - 0.76 Cents a Day for 3 Months! Click here

Access 7 Analysts Over 170 Markets Covered. Chat Room With Support

Bhp-Group-Ltd-4Hr-As...

Conclusion:
Our analysis and forecast for ASX: BHP GROUP LIMITED - BHP aim to provide insights into current market trends and effective strategies to capitalize on them. We offer specific price points as validation or invalidation signals for our wave count, enhancing confidence in our perspective. By combining these factors, we strive to offer the most objective and professional view on market trends.

Related

TASI Index Elliott Wave Forecast: Daily and Weekly Chart Analysis for Trading Strategies, Wave Counts, and Market Insights

TASI Index Elliott Wave Forecast: Daily and Weekly Chart Analysis for Trading Strategies, Wave Counts, and Market Insights

TASI Index with detailed Elliott Wave forecasts for daily and weekly charts, providing trading strat...

Read More >
Soybeans Commodity Elliott Wave Technical Analysis: Detailing the Market Trends, and Price Forecasts

Soybeans Commodity Elliott Wave Technical Analysis: Detailing the Market Trends, and Price Forecasts

This article provides a comprehensive Elliott Wave Analysis for soybeans, detailing the market trend...

Read More >
ASX BHP GROUP LIMITED - BHP Elliott Wave Forecast: Wave 3 Surge, $37–$40 Entry Zone & $33.25 Invalidation Technical Outlook

ASX BHP GROUP LIMITED - BHP Elliott Wave Forecast: Wave 3 Surge, $37–$40 Entry Zone & $33.25 Invalidation Technical Outlook

Elliott Wave analysis on ASX: BHP Group, focusing on wave‑3 development. Includes bullish price tar...

Read More >
Unlocking ASX Trading Success: V300AEQ ETF UNITS – VAS Stock Analysis & Elliott Wave Technical Forecast

Unlocking ASX Trading Success: V300AEQ ETF UNITS – VAS Stock Analysis & Elliott Wave Technical Forecast

This article provides a detailed Elliott Wave analysis of the ASX V300AEQ ETF Units - VAS. It includ...

Read More >
Commodities & Futures Market Analysis: Elliott Wave Insights & Strategies

Commodities & Futures Market Analysis: Elliott Wave Insights & Strategies

Discover profitable opportunities in the Commodities and Futures Trading Market with our comprehen...

Read More >
Natural Gas Commodity Market Outlook: Experiencing a Bearish Trend According to Elliott Wave Technical Analysis

Natural Gas Commodity Market Outlook: Experiencing a Bearish Trend According to Elliott Wave Technical Analysis

Natural Gas is experiencing a bearish trend according to Elliott Wave analysis, with further downsid...

Read More >

$1 for 2 Weeks

then $29 a month!

What a Special Offer!

Trade Recommendations

Unleash the power of deversified trading with our comprehensive portfolio, covering 250+ markets:

  • Stock Trades
  • Crypto Trades
  • Forex Trades
  • Commodity Trades
Elliott Wave Analysis

Gain a competitive edge with expert insights and AI-powered Elliott Wave charting into:

  • Global Indices
  • US Stocks & ASX Stocks
  • Forex & Crypto
  • Commodities
Top-Notch Trading Tools

Equip yourself with the tools of success:

  • Real-time Chat rooms
  • Elliott Wave Algorithm
  • Portfolio tools
  • TradingLevels
  • Screener
  • Trading Game
7 Elliott Wave Analysts

Stay ahead of the market with daily charts and insightful videos
Your secret to strategic trading!

JOIN HERE


Welcome to TradingLounge (ASIC A.R.No. 321187), specialists in trades, trading education and technical analysis, covering stocks, indices, commodities, forex and cryptocurrencies.

When you join TradingLounge you have access to everything we offer, including trade tools, educational content and a social platform to chat with like-minded investors.

Read more

@Copyright 2024 by tradinglounge.com

Contact Us

Australian no: 02 4787 6020

International no: +61 (2) 47876020

Pay with:

Find us on