30Jun

ADANI PORTS & SEZ Indian Stocks Elliott Wave Forecast: Bullish Impulse Wave 3 with Key Support Level and Price Prediction Update

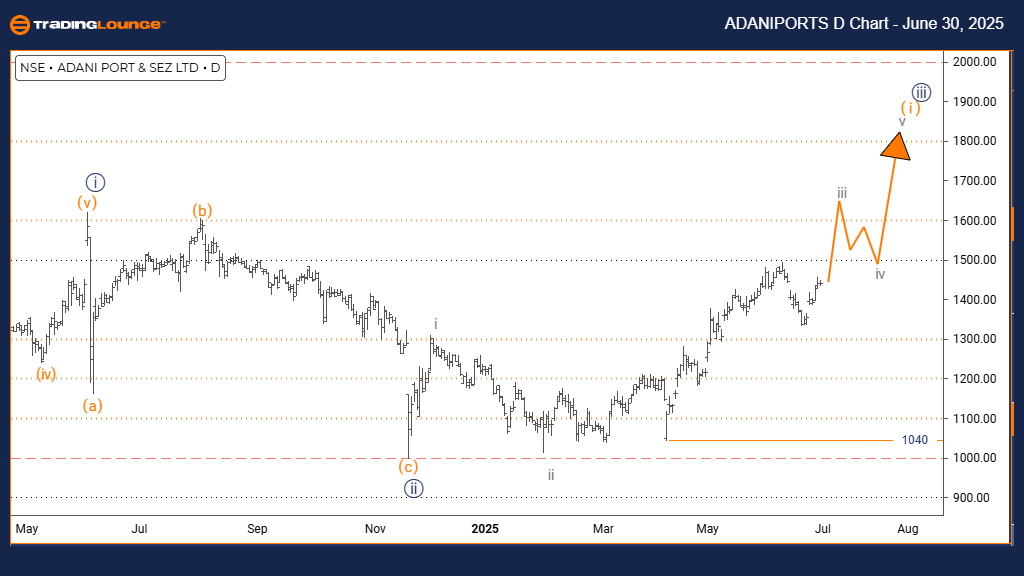
ADANI PORTS & SEZ Elliott Wave Analysis – TradingLounge Day Chart

ADANI PORTS & SEZ Day Chart Technical Overview

ADANI PORTS & SEZ Elliott Wave Technical Overview and Analysis

FUNCTION: Bullish Trend

MODE: Impulsive

STRUCTURE: Orange wave 1

POSITION: Navy blue wave 3

DIRECTION (Next Lower Degree): Orange wave 2

DETAILS: Navy blue wave 2 appears complete; orange wave 1 of 3 is now unfolding.

Invalidation Level: 1040

The daily chart for ADANI PORTS & SEZ highlights a sustained bullish trend supported by an impulsive wave pattern. The stock is currently forming orange wave 1, nested within navy blue wave 3, indicating the onset of a strong upward move in the medium term.

Elliott Wave analysis suggests that navy blue wave 2 has ended, making way for the emergence of orange wave 1 of 3, a sign of increasing bullish momentum. The anticipated correction phase, orange wave 2, could follow before the uptrend continues, offering potential entry opportunities for traders.

The critical support level is 1040—a drop below this level would invalidate the current wave structure, requiring a reassessment of the bullish scenario. As long as this level holds, the technical setup favors continued upward price action.

With orange wave 1 in progress and navy blue wave 2 confirmed complete, ADANI PORTS & SEZ appears positioned for further growth. The impulsive nature of the current movement reflects buyer strength and underscores a short-term bullish outlook.

ADANIPORTS-Day-Chart...


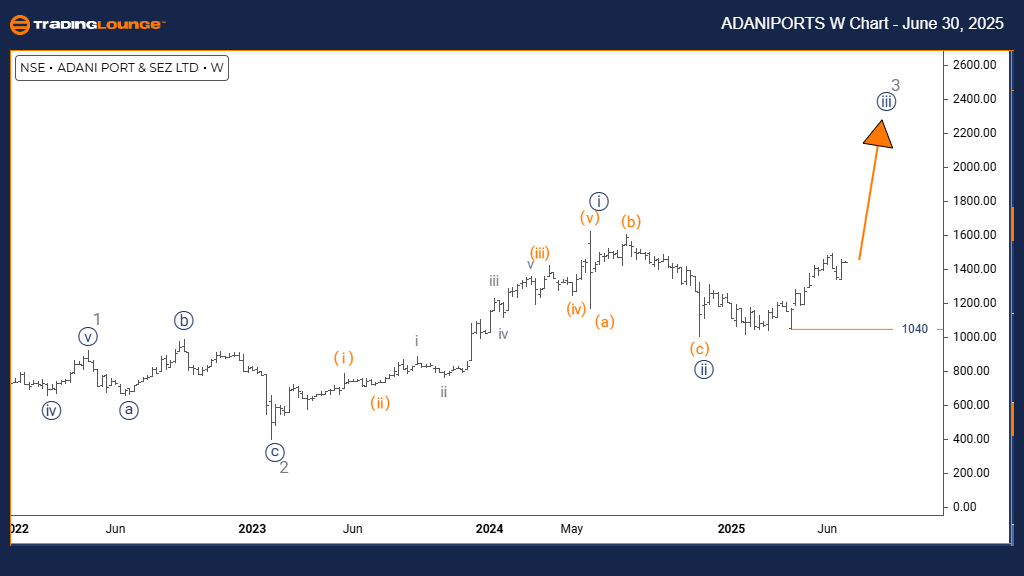
ADANI PORTS & SEZ Elliott Wave Analysis – TradingLounge Weekly Chart

ADANI PORTS & SEZ  Technical Overview – Elliott Wave Analysis

FUNCTION: Bullish Trend

MODE: Impulsive

STRUCTURE: Navy blue wave 3

POSITION: Gray wave 3

DIRECTION (Next Lower Degree): Navy blue wave 4

DETAILS: Navy blue wave 2 appears complete; wave 3 is now in motion.

Invalidation Level: 1040

The weekly Elliott Wave chart of ADANI PORTS & SEZ shows a strong bullish formation within navy blue wave 3, which belongs to the larger gray wave 3 structure. This is typically the most aggressive part of a bullish cycle, characterized by steep and extended price increases.

Wave analysis confirms the completion of navy blue wave 2, setting the stage for the continuation of navy blue wave 3, often marked by rapid advances and minimal pullbacks. The next likely development will be navy blue wave 4, a corrective move following the completion of the current upward leg.

The 1040 level remains a key support threshold. A breach below this point would call for a reevaluation of the current Elliott Wave count. Until then, the bullish scenario remains intact and technically favored.

As navy blue wave 3 progresses, ADANI PORTS & SEZ shows a strong potential for upward continuation, supported by impulsive price action and robust investor sentiment. This aligns with the broader gray wave 3, reinforcing the medium- to long-term bullish perspective.

Technical Analyst: Malik Awais

Source: Visit Tradinglounge.com and learn from the Experts. Join TradingLounge Here

Previous: NTPC Elliott Wave Technical Analysis

VALUE Offer - $1 for 2 Weeks then $29 a month!Click here

Access 7 Analysts Over 200 Markets Covered. Chat Room With Support

ADANIPORTS-W-Chart-3...

Related

Tata Consumer Product Stocks Elliott Wave Technical Analysis and Tata Share Current Trend, Potential Price Movement

Tata Consumer Product Stocks Elliott Wave Technical Analysis and Tata Share Current Trend, Potential Price Movement

This article provides a comprehensive analysis of Tata Consumer Product using Elliott Wave theory. I...

Read More >
Insights for Traders on ChainLink's Price Movement, Trading Strategies and Technical Indicators: LINKUSD Elliott Wave Analysis

Insights for Traders on ChainLink's Price Movement, Trading Strategies and Technical Indicators: LINKUSD Elliott Wave Analysis

This detailed analysis covers ChainLink (LINKUSD) price prediction using Elliott Wave theory, focusi...

Read More >
JAMES HARDIE INDUSTRIES PLC (JHX) Elliott Wave Analysis: ASX Stock Forecast, Price Prediction, Technical Trends & Insights

JAMES HARDIE INDUSTRIES PLC (JHX) Elliott Wave Analysis: ASX Stock Forecast, Price Prediction, Technical Trends & Insights

James Hardie (JHX) Elliott Wave analysis provides a detailed stock forecast for ASX investors. With ...

Read More >
Commodities & Futures Market Analysis: Elliott Wave Insights & Strategies

Commodities & Futures Market Analysis: Elliott Wave Insights & Strategies

COMMODITY MARKETS: Bond Yields, USD Dollar DXY, US Gold, Silver, Iron Ore,Copper, Uranium, Oil, Gas

Read More >
Unlocking ASX Trading Success: TRANSURBAN GROUP – TCL Stock Analysis & Elliott Wave Technical Forecast

Unlocking ASX Trading Success: TRANSURBAN GROUP – TCL Stock Analysis & Elliott Wave Technical Forecast

The Transurban Group's stock performance (TCL) on the ASX through the lens of Elliott Wave theor...

Read More >

$1 for 2 Weeks

then $29 a month!

What a Special Offer!

Trade Recommendations

Unleash the power of deversified trading with our comprehensive portfolio, covering 250+ markets:

  • Stock Trades
  • Crypto Trades
  • Forex Trades
  • Commodity Trades
Elliott Wave Analysis

Gain a competitive edge with expert insights and AI-powered Elliott Wave charting into:

  • Global Indices
  • US Stocks & ASX Stocks
  • Forex & Crypto
  • Commodities
Top-Notch Trading Tools

Equip yourself with the tools of success:

  • Real-time Chat rooms
  • Elliott Wave Algorithm
  • Portfolio tools
  • TradingLevels
  • Screener
  • Trading Game
7 Elliott Wave Analysts

Stay ahead of the market with daily charts and insightful videos
Your secret to strategic trading!

JOIN HERE


Welcome to TradingLounge (ASIC A.R.No. 321187), specialists in trades, trading education and technical analysis, covering stocks, indices, commodities, forex and cryptocurrencies.

When you join TradingLounge you have access to everything we offer, including trade tools, educational content and a social platform to chat with like-minded investors.

Read more

@Copyright 2024 by tradinglounge.com

Contact Us

Australian no: 02 4787 6020

International no: +61 (2) 47876020

Pay with:

Find us on