Natural Gas Elliott Wave Analysis

Natural Gas Elliott Wave Technical Analysis


Mode: Larger Degree Bullish Correction

Structure: Impulse Wave (Wave C in Blue) of Flat Pattern

Position: Wave (3)

Direction: Wave (3) in Progress

Analysis Overview

The recent surge above the key resistance zone has necessitated a re-evaluation of the Natural Gas market. Consequently, both daily and H4 charts have been updated to reflect an alternative scenario. The recovery from the 1.524 low is unfolding as an impulse wave, currently advancing into wave (3).

Natural Gas has extended its recovery from the February 2024 low. The commodity is expected to rise further, forming an impulse wave within the Elliott Wave framework. In the broader context, prices are in a corrective phase following the bearish cycle that ended between August 2022 and April 2023.

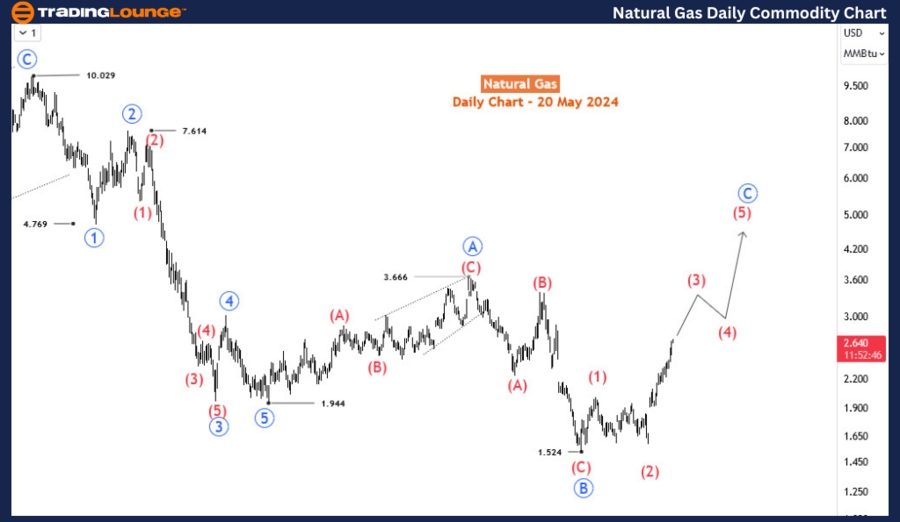
Daily Chart Analysis

On the daily chart, a bearish impulse wave was observed from August 2022 to April 2023. Following this decline, a corrective recovery is anticipated, moving upward in an expanding flat pattern. Expanding flats are characterized by a 3-3-5 ABC structure where the second three-wave segment exceeds the starting price of the first segment, and the third five-wave segment surpasses the endpoint of the first segment (or the starting price of the second segment).

The emerging flat pattern for Natural Gas began at 1.944 (April 2023 low) and completed the first three-wave segment—blue wave A—at 3.66 (October 2023 high). The second three-wave segment, blue wave B, extended below 1.944, reaching 1.524 (February 2024 low). The final leg, blue wave C, is ongoing and expected to extend above 3.66 with an impulsive move. Currently, the price is in wave (3) of blue wave C.
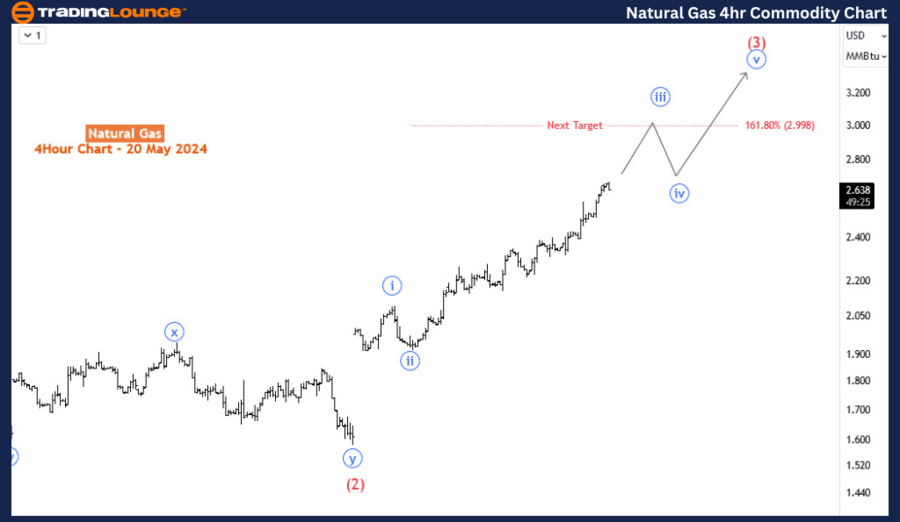
Natural-Gas-1d-commo...


H4 Chart Analysis

The H4 chart provides a closer look at the sub-waves within wave (3). The price is now in the third sub-wave, targeting the 2.998 Fibonacci level or potentially higher before the fourth sub-wave initiates a downward movement. In the near term, there is strong potential for further upside in Natural Gas prices.

Conclusion

Natural Gas has shown a significant recovery since its February 2024 low, aligning with an Elliott Wave impulse pattern. The larger trend suggests that prices are in a bullish corrective phase, aiming for higher levels in wave C of an expanding flat. Traders should monitor key Fibonacci levels and wave structures for potential continuation or reversal signals.

Technical Analyst: Sanmi Adeagbo

Source: visit Tradinglounge.com and learn From the Experts Join TradingLounge Here 

See Previous: Cocoa Elliott Wave Technical Analysis

Special Trial Offer - 0.76 Cents a Day for 3 Months! Click here

Access 7 Analysts Over 170 Markets Covered. Chat Room With Support

Natural-Gas-4Hr-comm...

Related

Nikkei 225 (N225) Elliott Wave Forecast Shows Bullish Wave 3 Structure with Strong Uptrend Signals Across Daily and Weekly Charts

Nikkei 225 (N225) Elliott Wave Forecast Shows Bullish Wave 3 Structure with Strong Uptrend Signals Across Daily and Weekly Charts

Nikkei 225 reveals a strong bullish trend with impulsive wave formations on both daily and weekly ch...

Read More >
ASX: CAR Group Limited – Comprehensive Elliott Wave Analysis Reveals Bullish Trends and Key Price Targets for Traders

ASX: CAR Group Limited – Comprehensive Elliott Wave Analysis Reveals Bullish Trends and Key Price Targets for Traders

This article provides an in-depth Elliott Wave technical analysis of ASX: CAR Group Limited. It outl...

Read More >
Enhance your investment outcomes in National Australia Bank Limited - NAB Elliott Wave Technical Forecast

Enhance your investment outcomes in National Australia Bank Limited - NAB Elliott Wave Technical Forecast

Discover comprehensive Elliott Wave analysis for ASX: NATIONAL AUSTRALIA BANK LIMITED (NAB). Our in-...

Read More >
Elliott Wave Analysis and Trading Strategies for NASDAQ Tech Stocks

Elliott Wave Analysis and Trading Strategies for NASDAQ Tech Stocks

The summary of the Elliott Wave analysis for NASDAQ tech stocks indicates that there might be a pote...

Read More >
Lululemon athletica Inc. (LULU) Stock Forecast: Elliott Wave Technical Analysis, Resistance Levels, and Investment Strategies

Lululemon athletica Inc. (LULU) Stock Forecast: Elliott Wave Technical Analysis, Resistance Levels, and Investment Strategies

Lululemon (LULU) stock provides a detailed Elliott Wave forecast, highlighting key technical pattern...

Read More >
Shanghai Composite Elliott Wave Daily‑Weekly Forecast: Gray Wave 2 Correction and Bullish Orange Wave 3 Breakout Outlook

Shanghai Composite Elliott Wave Daily‑Weekly Forecast: Gray Wave 2 Correction and Bullish Orange Wave 3 Breakout Outlook

Elliott Wave analysis of the Shanghai Composite Index. The daily chart highlights a corrective gray ...

Read More >

$1 for 2 Weeks

then $29 a month!

What a Special Offer!

Trade Recommendations

Unleash the power of deversified trading with our comprehensive portfolio, covering 250+ markets:

  • Stock Trades
  • Crypto Trades
  • Forex Trades
  • Commodity Trades
Elliott Wave Analysis

Gain a competitive edge with expert insights and AI-powered Elliott Wave charting into:

  • Global Indices
  • US Stocks & ASX Stocks
  • Forex & Crypto
  • Commodities
Top-Notch Trading Tools

Equip yourself with the tools of success:

  • Real-time Chat rooms
  • Elliott Wave Algorithm
  • Portfolio tools
  • TradingLevels
  • Screener
  • Trading Game
7 Elliott Wave Analysts

Stay ahead of the market with daily charts and insightful videos
Your secret to strategic trading!

JOIN HERE


Welcome to TradingLounge (ASIC A.R.No. 321187), specialists in trades, trading education and technical analysis, covering stocks, indices, commodities, forex and cryptocurrencies.

When you join TradingLounge you have access to everything we offer, including trade tools, educational content and a social platform to chat with like-minded investors.

Read more

@Copyright 2024 by tradinglounge.com

Contact Us

Australian no: 02 4787 6020

International no: +61 (2) 47876020

Pay with:

Find us on