Cocoa Elliott Wave Analysis
Function - Counter-trend
Mode - Corrective
Structure - Not yet defined
Position - Blue wave ‘a’
Direction - Blue wave ‘a’ is still in play
Details - The wave count has been adjusted. Blue wave ‘a’ is in sub-wave (v) that could extend lower. Afterward, the price could still return upside to correct blue wave ‘a’. Same as the previous update.
Cocoa Elliott Wave Technical Analysis
Since April 22nd, cocoa prices have been retracing their long-term bullish trend, shedding over 35% from their recent peak. According to the Elliott wave theory, further declines are expected, and we will explore this bearish outlook in detail.
Daily Chart Analysis
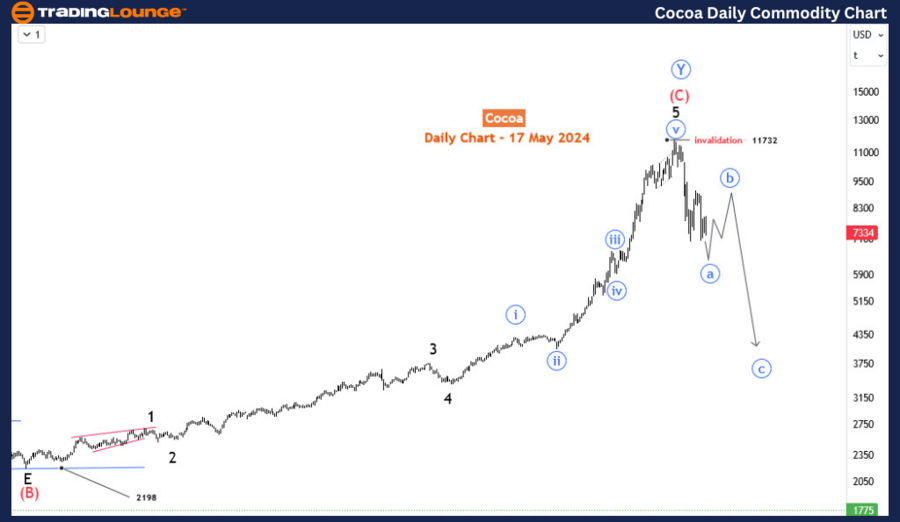
On the daily chart, cocoa completed an extended bullish impulse wave from the September 2022 low of 2198. This impulse wave culminated in an all-time high of 11732, marking the end of a significant upward movement. From this high, we anticipate at least a three-wave corrective decline (A-B-C pattern), if not a full five-wave impulse decline.
Currently, the first leg of this corrective phase, labeled as blue wave 'a', is nearing the end of its impulse phase. This suggests that after wave 'a' concludes, a corrective blue wave 'b' will likely follow, providing a temporary upward movement. However, the overall structure points to a further decline once wave 'b' completes, leading into the downward blue wave 'c'.

H4 Chart Analysis
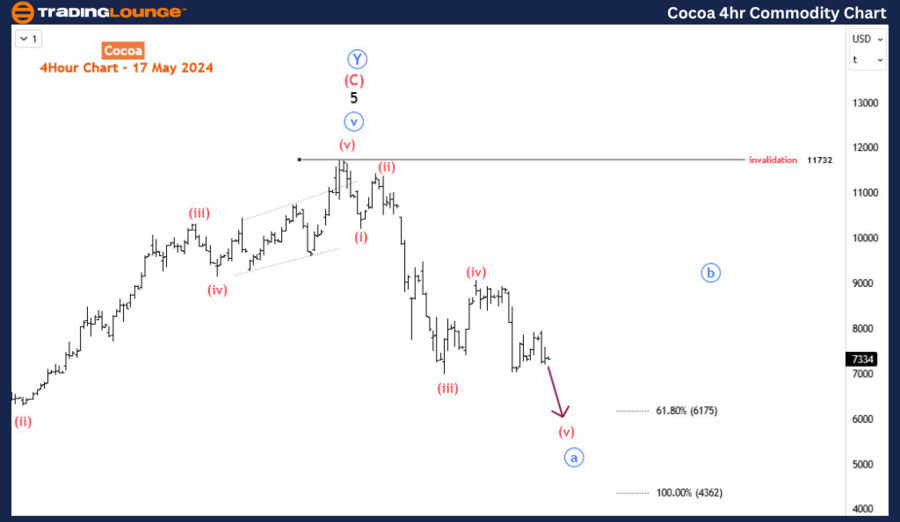
On the H4 chart, the detailed structure of blue wave 'a' is more evident. The price is currently in wave (v) of blue wave 'a', indicating the final stage of the initial impulse decline from the 11732 high. Wave (v) signifies the last leg of this downward movement, and we anticipate further extensions lower towards the 6175-4362 range before a significant bullish correction takes place.
The range of 6175-4362 is critical as it represents potential support levels where the market might find temporary respite before resuming its downward trajectory. A bullish correction against the 11732 high is expected following this decline, but it will likely be short-lived within the broader bearish context.
Outlook
Given this outlook, unless cocoa prices rally sharply and surpass the 11732 high, the near-term outlook remains bearish. For short-term and swing traders, the recommended strategy is to sell on bounces. This approach capitalizes on minor upward corrections within the larger downtrend, allowing traders to position themselves advantageously as the market continues its descent.
In conclusion, the Elliott wave analysis indicates that cocoa prices are set for further declines. The immediate focus should be on the completion of wave (v) of blue wave 'a' and the subsequent correction in blue wave 'b'. Traders should remain cautious and look for selling opportunities on upward retracements to maximize their potential gains during this bearish phase.
Technical Analyst: Sanmi Adeagbo
Source: visit Tradinglounge.com and learn From the Experts Join TradingLounge Here
See Previous: Gold XAUUSD Commodity Elliott Wave Analysis
Special Trial Offer - 0.76 Cents a Day for 3 Months! Click here
Access 7 Analysts Over 170 Markets Covered. Chat Room With Support
