Gold’s Ongoing Bullish Trend: An Elliott Wave Perspective

Function: Trend

Mode: Impulse

Structure: Impulse Wave

Position: Wave 5

Direction: Wave 5 is still in progress

Details: Impulse breakout for wave 5 progresses. The upside is still favoured. Same interpretation as the previous one. The invalidation level is below 2276.

Gold has resumed its upward trend after three weeks of correcting its long-term bullish cycle. Unless a sharp decline occurs, the potential for further rallies remains strong. This analysis examines the entire bullish cycle from October 2023 and the current price position within the Elliott wave framework of the impulse rally.

Daily Chart Analysis: Bullish Trend Resumption

On the daily chart, renewed strength began in October 2023 when the 12% decline from May 2023 ended at 1810.5. This bullish move traces back to the September 2022 low of 1616.9, where the 4th wave of a supercycle degree impulse, which started in late 2015, concluded. Therefore, the bullish progress since 1616.9 is part of wave (V) of the supercycle degree. According to Elliott wave principles, this signifies a powerful and extended move, as supercycle waves typically encompass large and sustained price changes.

Gold-XAUUSD-Daily-Co...


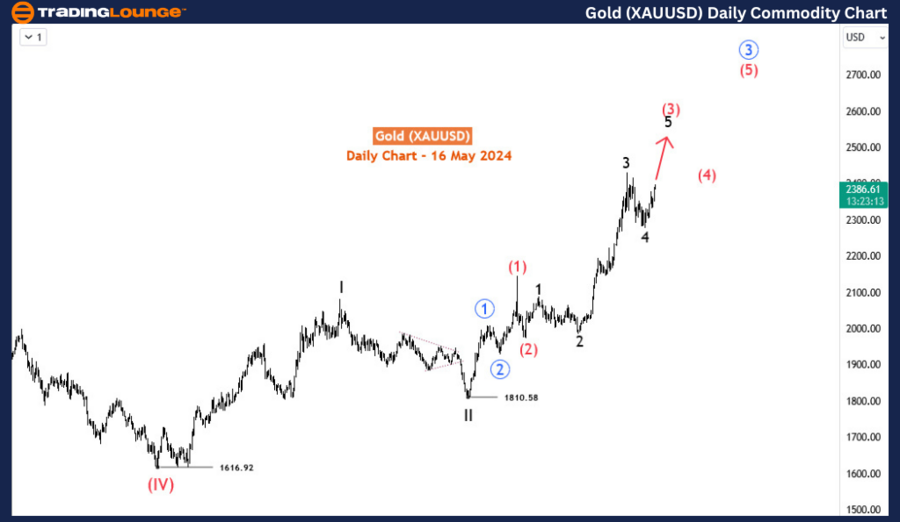
Wave III Analysis: High Momentum and Strong Price Movements

The daily chart indicates that the price is in wave III of (V), which hasn't yet completed its 3rd sub-wave of the primary degree in blue. Wave III is typically the most dynamic and extended phase of an impulse wave, often characterized by strong price movements and high momentum. Within this context, the bullish potential for gold is substantial and suggests an extended upward trajectory that could last for several years.

Current Position: Wave 5 of (3)

Currently, gold is in wave 5 of (3) of the blue '3'. This final wave 5 of (3) is crucial as it will complete the larger wave III structure before a more significant correction occurs. Based on wave analysis, wave 5 has not yet ended and could extend to the 2463-2500 range or even higher in the coming weeks. This projection aligns with the typical behavior of wave 5, which often stretches to new highs, fueled by the final burst of investor enthusiasm.

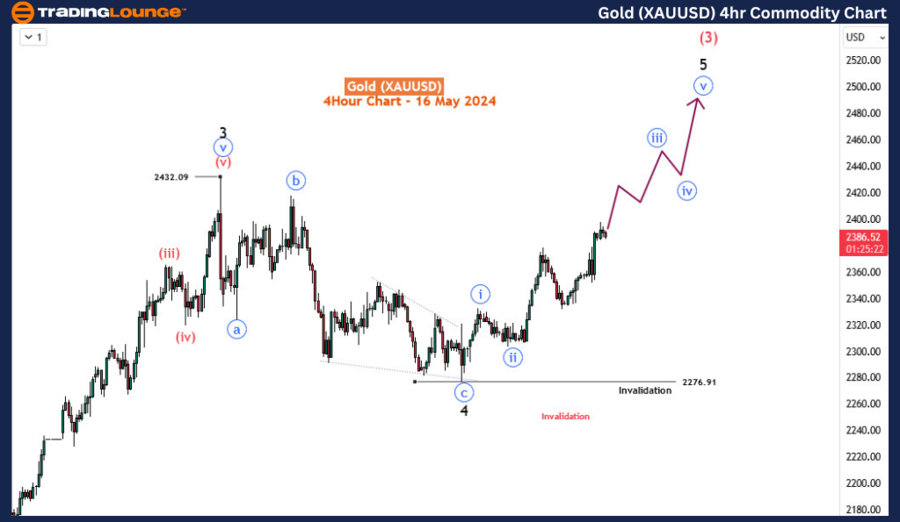
H4 Chart Analysis: Wave 4 and Emerging Wave 5

On the H4 chart, wave 4 ended with a classic zigzag structure, a common corrective pattern that sets the stage for the next impulse wave. Following this, wave 5 has begun to emerge, indicating a resumption of the bullish trend. The price is currently in the minute degree (circled in blue) wave iii of 5. As long as the price remains above 2276, the impulse for wave 5 is expected to continue its ascent in the near term.

Conclusion: Gold's Future Prospects

Gold's Elliott wave analysis indicates a strong bullish trend that began in October 2023 and shows no signs of slowing down. The ongoing wave III of (V) suggests substantial upward potential, with wave 5 of (3) projected to reach new highs. Investors should watch the key invalidation level of 2276, as staying above this level supports the continuation of the bullish trend.

Technical Analyst: Sanmi Adeagbo

Source: visit Tradinglounge.com and learn From the Experts Join TradingLounge Here 

See Previous: Coffee Commodity Elliott Wave Technical Analysis

Special Trial Offer - 0.76 Cents a Day for 3 Months! Click here

Access 7 Analysts Over 170 Markets Covered. Chat Room With Support

Gold-XAUUSD-4Hr-Comm...

Related

U.S.Dollar/Japanese Yen (USDJPY) 4 Hour and Day Chart Elliott Wave Technical Analysis 17 October 23

U.S.Dollar/Japanese Yen (USDJPY) 4 Hour and Day Chart Elliott Wave Technical Analysis 17 October 23

In summary, the USD/JPY Elliott Wave Analysis for 17 October 23, provides valuable insights for trad...

Read More >
Master the Euro/U.S. Dollar Forex Market: Advanced EURUSD Elliott Wave Technical Analysis for Precision Trading on Day and 4-Hour Charts

Master the Euro/U.S. Dollar Forex Market: Advanced EURUSD Elliott Wave Technical Analysis for Precision Trading on Day and 4-Hour Charts

Gain a thorough understanding of the EURUSD market with our detailed Elliott Wave analysis. This art...

Read More >
Valuable Forex Trading Strategies For U.S. Dollar / Swiss Franc Currency Pair with USDCHF Elliott Wave Technical Analysis

Valuable Forex Trading Strategies For U.S. Dollar / Swiss Franc Currency Pair with USDCHF Elliott Wave Technical Analysis

This article provides a thorough USDCHF analysis based on Elliott Wave theory, covering daily and 4-...

Read More >
Elliott Wave Technical analysis of PayPal Holdings Inc. (PYPL) Stock Highlighting the Current Market Structure and Movements

Elliott Wave Technical analysis of PayPal Holdings Inc. (PYPL) Stock Highlighting the Current Market Structure and Movements

This article provides a comprehensive Elliott Wave analysis of PayPal Holdings Inc. (PYPL), highligh...

Read More >
Effective Trading Strategies: Chainlink Crypto Price News Today Elliott Wave Technical Analysis

Effective Trading Strategies: Chainlink Crypto Price News Today Elliott Wave Technical Analysis

This article provides an in-depth Elliott Wave Analysis for ChainLink (LINKUSD), offering insights i...

Read More >
USDJPY Elliott Wave Technical Analysis Shows U.S. Dollar/Japanese Yen Forex Currency Pair is Currently in a Downward Trend Phase

USDJPY Elliott Wave Technical Analysis Shows U.S. Dollar/Japanese Yen Forex Currency Pair is Currently in a Downward Trend Phase

The USDJPY currency pair is currently in a downward trend phase according to Elliott Wave analysis. ...

Read More >

Buy 1 Month

Get 3 Months!

Special Offer:

Trade Recommendations

Unleash the power of deversified trading with our comprehensive portfolio, covering:

  • Stock Trades
  • Crypto Trades
  • Forex Trades
  • Commodity Trades
Elliott Wave Analysis

Gain a competive edge with expert insights in to:

  • Global Indices
  • US Stocks & ASX Stocks
  • Forex & Crypto
  • Commodities
Top-Notch Trading Tools

Equip yourself with the tools of success:

  • Social Chat
  • Elliott Wave Algorithm
  • Screener
  • TradingLevels
  • Trading Game
7 Elliott Wave Analysts

Stay ahead of the market with daily charts and insightful videos
-Your secret to strategic trading!

JOIN HERE


Welcome to TradingLounge (ASIC A.R.No. 321187), specialists in trades, trading education and technical analysis, covering stocks, indices, commodities, forex and cryptocurrencies.

When you join TradingLounge you have access to everything we offer, including trade tools, educational content and a social platform to chat with like-minded investors.

Read more

@Copyright 2024 by tradinglounge.com

Contact Us

Australian no: 02 4787 6020

International no: +61 (2) 47876020

Pay with:

Find us on