Coffee Elliott Wave Analysis: A Detailed Trend and Price Prediction
Function: Trend
Mode: Impulse
Structure: Impulse Wave
Position: Blue Wave IV
Direction: Blue Wave V
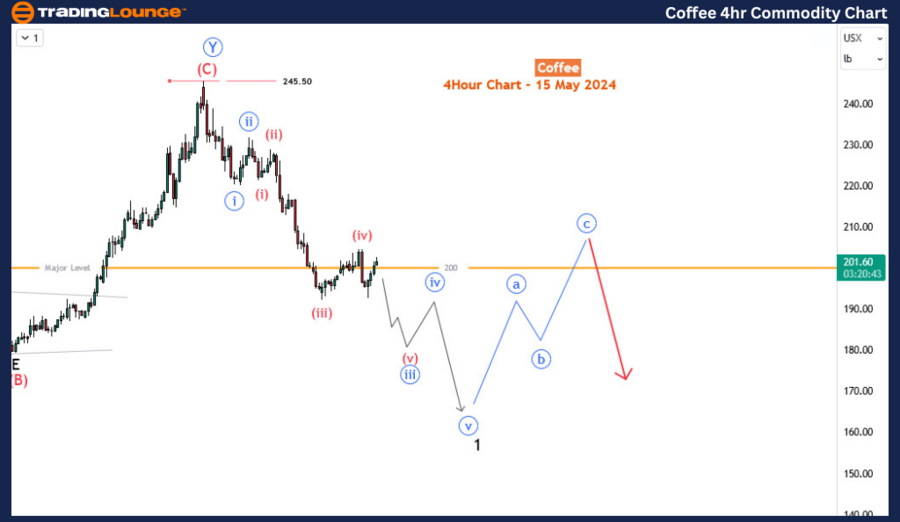
Details: Currently, the market anticipates an impulse decline starting from 245.5, targeting the 179.7-170.15 Fibonacci retracement zone. This trend will invalidate if prices climb above 220.
Coffee Elliott Wave Technical Analysis
Historical Context and Recent Movements of Coffee Prices
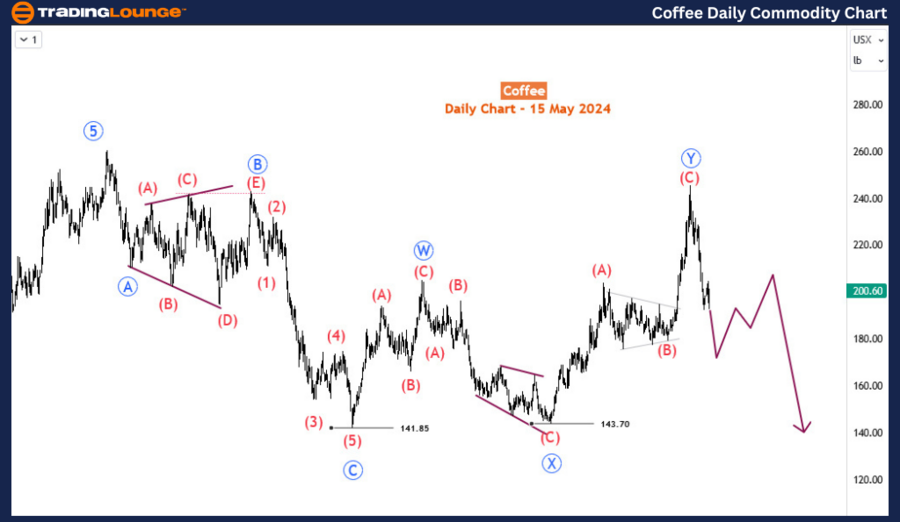
Since April 18, 2024, there has been a notable downturn in coffee prices, effectively nullifying the gains seen from the bullish trend that commenced on April 2, 2024. Prior to this surge, coffee prices were relatively stagnant, but they escalated dramatically, over 28%, peaking in mid-April. Unfortunately, this peak was short-lived, and the recent market actions suggest a reversal of these gains. This analysis aims to provide both long- and medium-term forecasts concerning the coffee market.
Long-Term Analysis: Patterns on the Daily Chart
On a broader scale, the daily chart reveals a long-term sideways movement in coffee prices, marked by two completed corrective cycles. January 2023 saw the beginning of the second cycle at 141.85, culminating in a double zigzag pattern at 245—the high of April 2024. It is likely that a third cycle will ensue, potentially forming another corrective structure. Currently, the market is witnessing an impulse decline from the April 2024 high, designated as wave (A) of this third cycle. While the medium-term outlook remains bearish, the focus in the near term is on this emerging impulse.

Medium-Term Forecast: Analysis on the H4 Chart
The finer details on the H4 chart indicate that the impulse from 245.5 is progressing into its third leg—blue wave ‘iii’. With prices hovering around the critical 200 level, wave (iv) may see a slight increase, or it may have already concluded. It is expected that the prices will continue to fall, completing blue wave ‘iii’ and ‘v’, leading up to the completion of wave 1. After this, a corrective bounce in wave 2 could occur, potentially offering a significant selling opportunity shortly. It is crucial to note that any rise in prices above 245.5 will invalidate the development of wave 1.
Implications for Traders and Investors
The ongoing decline in coffee prices as per the Elliott Wave Principle suggests an impending bearish phase that could offer strategic opportunities for traders. Understanding these wave patterns provides insights not only into potential price drops but also into recovery phases, where corrective bounces can create buying opportunities in what is typically a volatile commodity market.
Conclusion: Preparing for the Next Moves in Coffee Prices
As coffee prices continue to navigate through these intricate wave patterns, stakeholders in the coffee market—from traders to investors—must stay vigilant and ready to adapt their strategies according to the wave predictions. The current bearish trend, marked by the impulse wave from the recent high, underscores the need for caution and precision in trading decisions.
Technical Analyst: Sanmi Adeagbo
Source: visit Tradinglounge.com and learn From the Experts Join TradingLounge Here
See Previous: Corn Commodity Elliott Wave Technical Analysis
Special Trial Offer - 0.76 Cents a Day for 3 Months! Click here
Access 7 Analysts Over 170 Markets Covered. Chat Room With Support
