WTI Crude Oil Elliott Wave Technical Analysis
WTI crude oil continues to face downward pressure after failing to sustain a return to the $80 price level in October. Over the past four weeks, the commodity has recorded net losses, adding to the sell-off that began in March 2022, when prices peaked near $131. From a technical perspective, bearish risks remain high, and traders may see prices decline toward $60 in the near future.
WTI Crude Oil Daily Chart Analysis
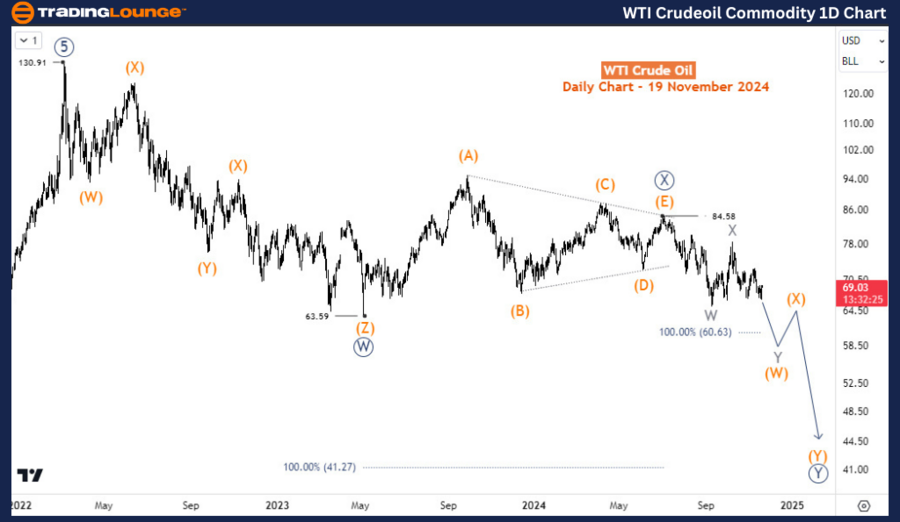
On the daily chart, the sell-off from $130.91 is corrective and unfolding into a double zigzag structure. from the big picture, the commodity is correcting the impulse rally starting from the Covid low in April 2020 to March 2022 when it reached a $130.91 peak.
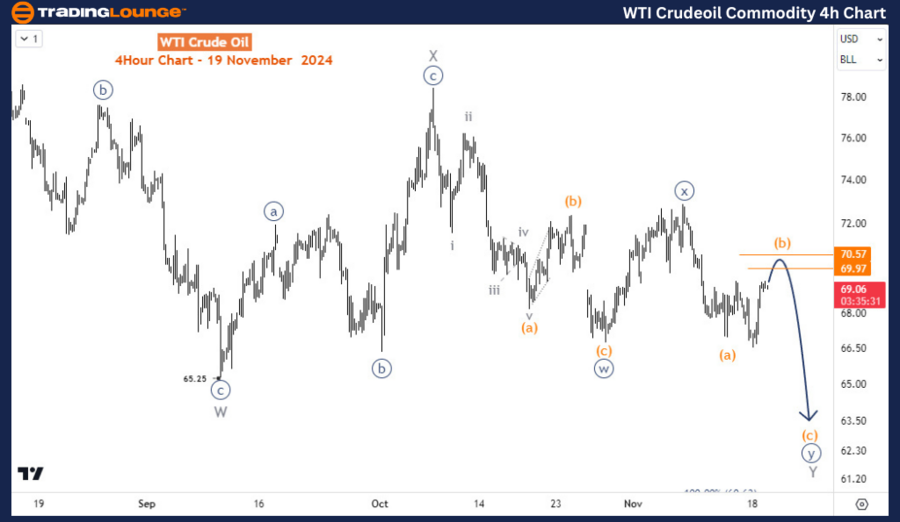
Wave ((W)) finished at 63.5 in May 2023 then followed by a triangle structure for wave ((X)) which finished at 85.5 in July 2024. From July, wave ((Y)) has evolved. Based on the previous and current price action, we will anticipate a double or triple zigzag structure for wave ((Y)) which could extend to $41 in the coming months. However, $60.6 is the next target where we expect wave (W) of ((Y)) to finish before another bounce for (X).

WTI Crude Oil H4 Chart Analysis
Technical Analyst: Sanmi Adeagbo
Source: visit Tradinglounge.com and learn From the Experts Join TradingLounge Here
See Previous: Soybean Commodity Elliott Wave Technical Analysis
VALUE Offer - Buy 1 Month & Get 3 Months!Click here
Access 7 Analysts Over 200 Markets Covered. Chat Room With Support
