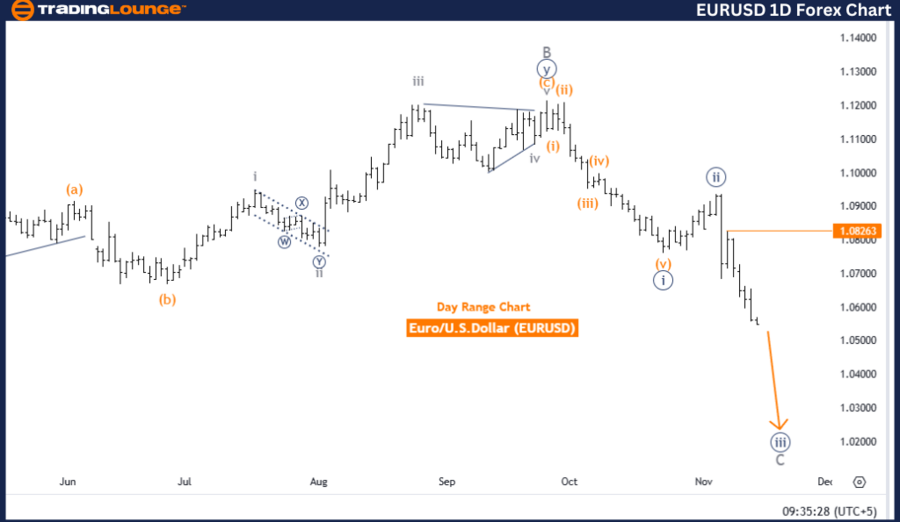
Euro/ U.S. Dollar (EURUSD) Elliott Wave Analysis - Trading Lounge Daily Chart Analysis
EURUSD Elliott Wave Technical Analysis
Function: Counter Trend
Mode: Impulsive
Structure: Navy Blue Wave 3
Position: Gray Wave C
Direction (Next Higher Degrees): Navy Blue Wave 4
Details: Navy blue wave 2 appears completed; navy blue wave 3 is currently active.
Wave Cancellation Invalidation Level: 1.08263
Analysis Overview
The EURUSD Elliott Wave daily chart analysis from Trading Lounge identifies a counter-trend movement in the Euro versus the U.S. Dollar. Navy blue wave 3, part of the impulsive wave structure and positioned within gray wave C, is the focal point of this analysis. This phase suggests a counter-trend with ongoing momentum shaping the broader market direction.
Despite the counter-trend designation, navy blue wave 3's impulsive nature indicates significant activity, with anticipated fluctuations as this wave unfolds.
Wave Details
- Navy blue wave 2 has likely completed its formation.
- Navy blue wave 3, a traditionally strong and active wave in Elliott Wave theory, is progressing.
- Although classified as counter-trend, wave 3 typically demonstrates robust activity, potentially creating short-term downward momentum within the broader corrective structure.
Key Level: Invalidation Threshold
The invalidation level is set at 1.08263, serving as a crucial marker for traders. If the EURUSD price drops to or below this level:
- The current wave structure would no longer hold validity.
- Such a break could indicate weakening in the counter-trend outlook, requiring a reevaluation of the wave pattern and broader trend analysis.
This level is essential for confirming the structural integrity of the counter-trend scenario.
Summary and Recommendations
The analysis supports a counter-trend perspective for EURUSD, with navy blue wave 3 evolving within the impulsive structure of gray wave C. Traders should monitor price activity closely near the 1.08263 invalidation level, as a drop below this level could challenge the current structure. Watching this key level is critical for validating the counter-trend framework.
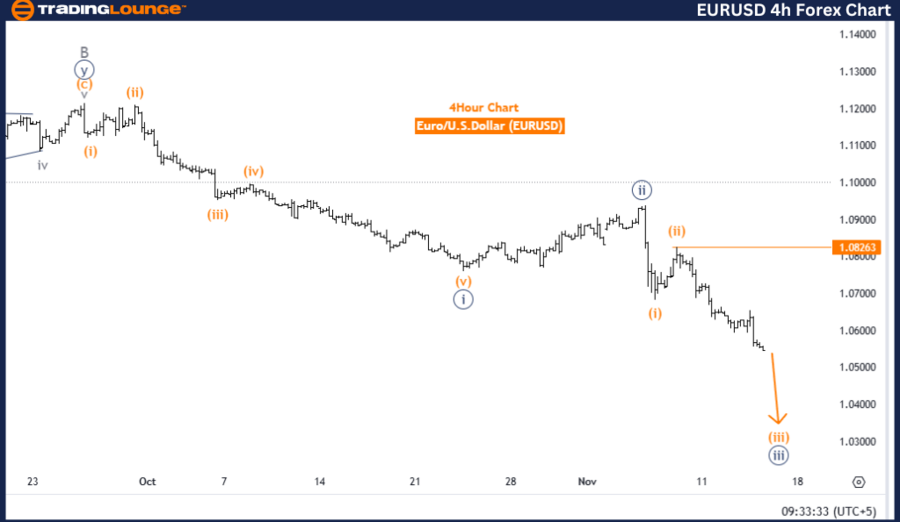
Euro/ U.S. Dollar (EURUSD) Elliott Wave Analysis - Trading Lounge 4-Hour Chart Analysis
EURUSD Elliott Wave Technical Analysis
Function: Bearish Trend
Mode: Impulsive
Structure: Orange Wave 3
Position: Navy Blue Wave 3
Direction (Next Higher Degrees): Orange Wave 4
Details: Orange wave 2 is completed; orange wave 3 within navy blue wave 3 is active.
Wave Cancellation Invalidation Level: 1.08263
Analysis Overview
The 4-hour EURUSD Elliott Wave analysis from Trading Lounge identifies a bearish trend for the Euro against the U.S. Dollar. Orange wave 3, part of the larger navy blue wave 3 structure, is active, signifying sustained downward momentum in the current Elliott Wave progression. This trend supports a bearish outlook as the wave structure continues to evolve.
Wave Details
- Orange wave 2 has completed its development, paving the way for orange wave 3 within navy blue wave 3 to advance.
- Wave 3 in Elliott Wave theory often marks a strong, directional movement, reinforcing the bearish sentiment.
- The positioning within navy blue wave 3 aligns with expectations for further short-term downward movement.
Key Level: Invalidation Threshold
The invalidation level for the bearish trend is identified at 1.08263. Should EURUSD rise above this level:
- The current wave structure would be invalidated.
- A move beyond this point could suggest weakening bearish momentum and necessitate a reevaluation of the wave framework.
This level is pivotal for validating the continuation of the downtrend. A break above could signal a shift or potential reversal in the market outlook.
Summary and Recommendations
The analysis emphasizes a bearish outlook for EURUSD, with orange wave 3 actively developing within navy blue wave 3, maintaining the downward momentum. Traders should pay close attention to price movements near the 1.08263 invalidation level, as an upward break could challenge the bearish structure. This threshold is critical for validating the continuation of the current bearish pattern.
Technical Analyst: Malik Awais
Source: visit Tradinglounge.com and learn From the Experts Join TradingLounge Here
Previous: GBPUSD Elliott Wave Technical Analysis
VALUE Offer - Buy 1 Month & Get 3 Months!Click here
Access 7 Analysts Over 200 Markets Covered. Chat Room With Support