COCHLEAR LIMITED - COH Elliott Wave Technical Analysis | TradingLounge
Overview:
Our latest Elliott Wave analysis for COCHLEAR LIMITED (ASX:COH) on the Australian Stock Exchange highlights a potential trend shift. The stock may have completed a Wave 2 correction and could now be entering Wave 3, a phase typically associated with stronger upward momentum. This report outlines the next bullish price target, critical invalidation level, and anticipated medium-term direction for ASX:COH.
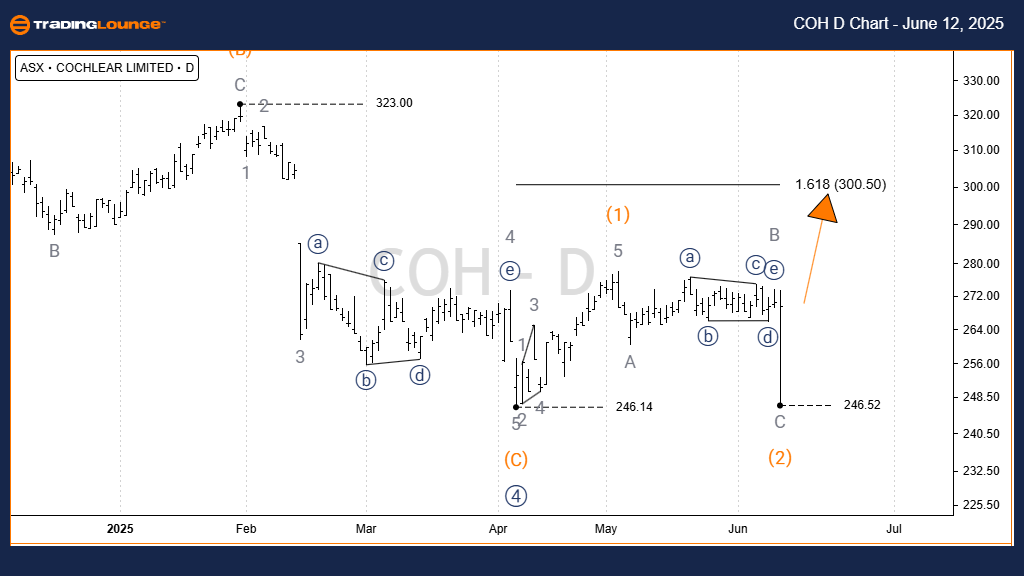
COCHLEAR LIMITED - COH 1D Chart Analysis (Semilog Scale)
Trend: Intermediate (Orange)
Wave Mode: Motive
Wave Structure: Impulse
Wave Position: Wave 5)) - Navy
Technical Insights:
Wave 4)) - Navy likely completed an ABC correction pattern (A,B,C) - Orange. The chart setup now points towards the start of Wave 5)) - Navy, implying a bullish continuation. The next price objective is around the previous high from Wave 3)) - Navy, approximately $350.00.
Invalidation Level: $246.52
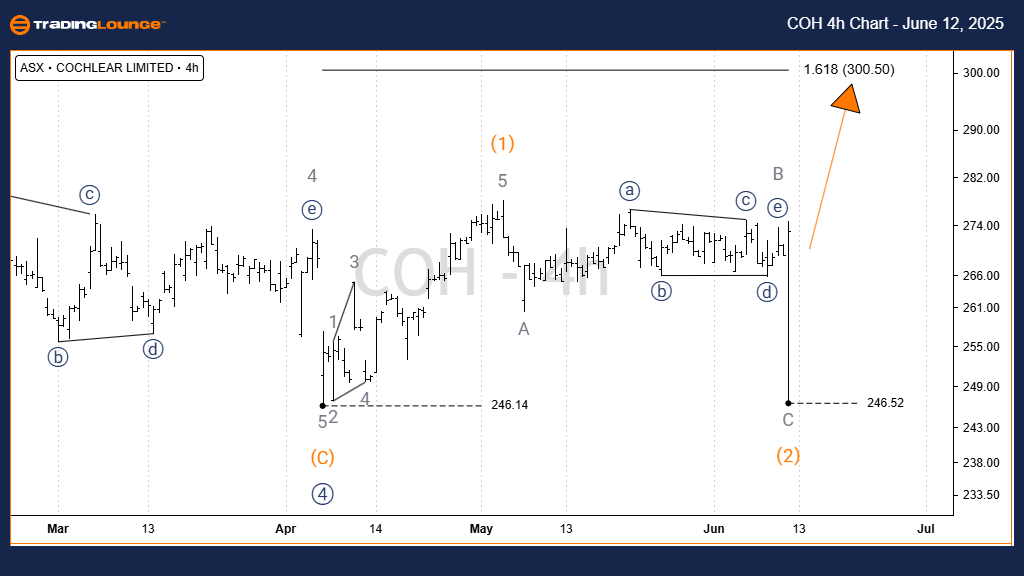
COCHLEAR LIMITED - COH Elliott Wave Technical Analysis | 4-Hour Chart
4-Hour Technical Overview:
Trend: Intermediate (Orange)
Wave Mode: Motive
Wave Structure: Impulse
Wave Position: Wave B - Grey of Wave 2) - Orange
Short-Term Forecast:
Following a leading diagonal formation in Wave 1) - Orange, ASX:COH experienced a sharp decline in Wave 2) - Orange, shaped as a classic Zigzag correction. This decline appears to have bottomed at $246.52, completing a clear three-wave move. If this low remains intact, a bullish Wave 3) - Orange may now be underway, with a target near $300.50 or higher.
Invalidation Level: $246.52
Technical Analyst: Hua (Shane) Cuong, CEWA-M (Master’s Designation).
Source: Visit Tradinglounge.com and learn from the Experts. Join TradingLounge Here
See Previous: MINERAL RESOURCES LIMITED - MIN Elliott Wave Technical Analysis
VALUE Offer - $1 for 2 Weeks then $29 a month!Click here
Access 7 Analysts Over 200 Markets Covered. Chat Room With Support
Conclusion:
This Elliott Wave analysis for COCHLEAR LIMITED (ASX:COH) aims to provide a clear view of the current wave structure, highlighting key price levels for confirmation or invalidation. By maintaining a professional and neutral approach, the analysis supports informed trading strategies aligned with wave-based market behavior.