This detailed Elliott Wave analysis focuses on Texas Instruments Incorporated (TXN) as observed in both the daily and 4-hour charts on May 6, 2024. Our analysis aims to provide investors and traders with actionable insights into the stock’s current trends and potential future movements.

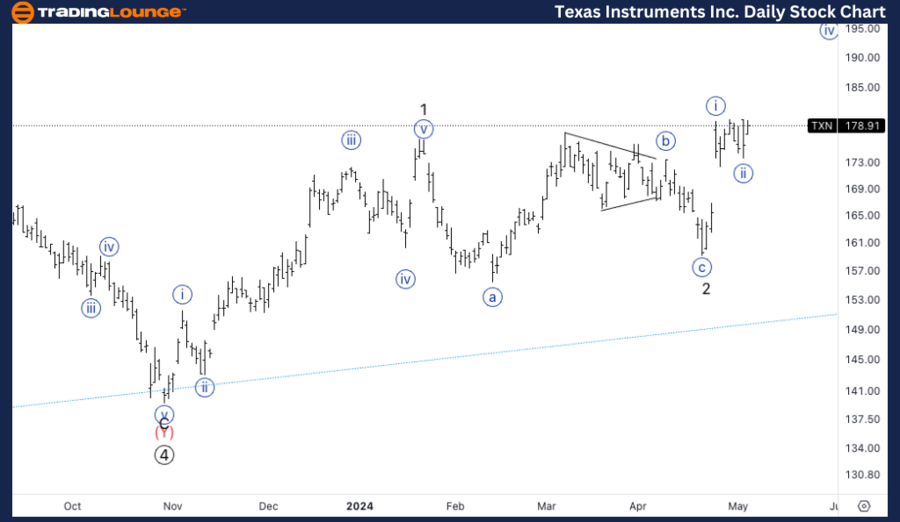
TXN Elliott Wave Analysis Trading Lounge Daily Chart,

Texas Instruments Inc., (TXN) Daily Chart

TXN Elliott Wave Technical Analysis

FUNCTION: Trend

MODE: Impulsive

STRUCTURE: Motive

POSITION: Minor 3

DIRECTION: Upside in Minor 3.  

DETAILS: Looking for at least equality of 3 vs. 1 as upside target, to eventually turn into an ABC in the worst of scenarios.

TXN Elliott Wave Technical Analysis – Daily Chart

The daily chart for TXN reveals that the stock is currently in an impulsive, motive wave pattern, identified as Minor wave 3. This suggests a strong upward trend, indicating potential for significant

gains. The analysis targets at least equality between wave 3 and wave 1, pointing towards a robust upside potential. In less favorable scenarios, this movement might evolve into an ABC correction pattern, but the primary expectation remains bullish.
Texas-Instruments-In...


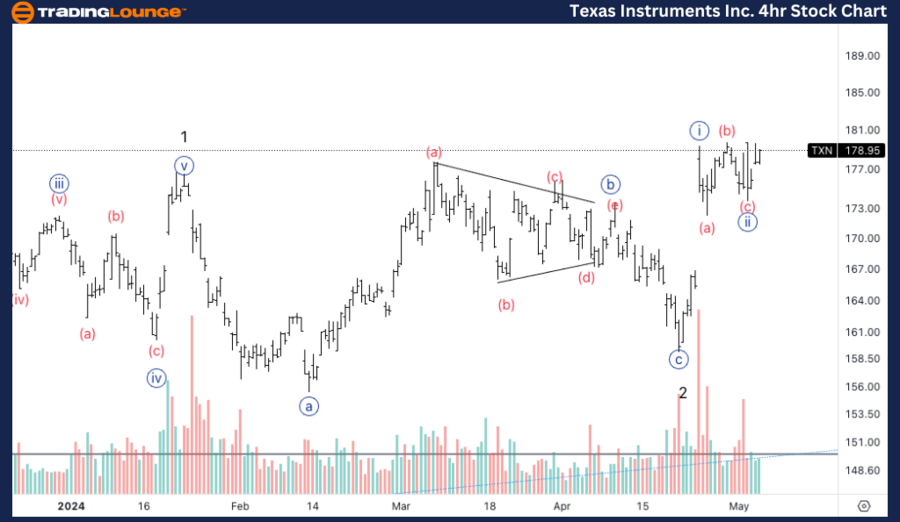
TXN Elliott Wavse Analysis Trading Lounge 4Hr Chart,

Texas Instruments Inc.,  (TXN) 4Hr Chart

TXN Elliott Wave Technical Analysis

FUNCTION: Trend

MODE: Impulsive

STRUCTURE: Motive

POSITION: Wave {ii} of 3.  

DIRECTION: Upside in {iii}.

DETAILS: Looking for acceleration in wave {iii}, with closing volume on Friday suggesting a bullish move to the upside.  

TXN Elliott Wave Technical Analysis – 4H Chart

Diving deeper into the 4-hour chart, TXN is positioned in Wave {ii} of Minor 3, forecasting an upcoming surge in Wave {iii}. The closing volume on the previous trading day (Friday) indicated a significant bullish sentiment, which aligns with expectations for an acceleration in Wave {iii}. This provides an excellent setup for traders looking to capitalize on the next upward move.

Technical Analyst: Alessio Barretta

Source: visit Tradinglounge.com and learn From the Experts Join TradingLounge Here 

See Previous: Microsoft Inc., (MSFT) 

Special Trial Offer - 0.76 Cents a Day for 3 Months! Click here

Access 6 Analysts covering over 150 Markets. Chat Room With Support
Texas-Instruments-In...

Related

NEO Crypto Price Elliott Wave Technical Analysis: Covers NEO Price Trends, Re-entry Points, and The Role of Bearish Momentum

NEO Crypto Price Elliott Wave Technical Analysis: Covers NEO Price Trends, Re-entry Points, and The Role of Bearish Momentum

Explore the latest NEOUSD Elliott Wave analysis focusing on the transition from wave 2 to wave 3, wi...

Read More >
S&P/TSX 60 Elliott Wave Analysis Signals Strong Bullish Trend with Impulse Wave in Progress and Key Support at 1339 for Canadian Stocks

S&P/TSX 60 Elliott Wave Analysis Signals Strong Bullish Trend with Impulse Wave in Progress and Key Support at 1339 for Canadian Stocks

The S&P/TSX 60 is showing a bullish Elliott Wave pattern, currently in Navy Blue Wave 3. Daily and w...

Read More >
Cardano (ADAUSD) Elliott Wave Analysis: Fibonacci Support, and Bullish Trading Strategy for Swing Traders and Crypto Investors

Cardano (ADAUSD) Elliott Wave Analysis: Fibonacci Support, and Bullish Trading Strategy for Swing Traders and Crypto Investors

Elliott Wave analysis of Cardano (ADA/USD), highlighting the current corrective phase in Wave II. It...

Read More >
Computershare (ASX: CPU) Elliott Wave Forecast Highlights Bullish Wave (v) Breakout with Key Price Targets and Support Levels

Computershare (ASX: CPU) Elliott Wave Forecast Highlights Bullish Wave (v) Breakout with Key Price Targets and Support Levels

ASX: CPU may have completed wave (IV) and started wave (V) with bullish potential. See key levels an...

Read More >
Elliott Wave Analysis of UnitedHealth Group (UNH): Stock Forecast, Wave 4 Completion, and Price Target at $650

Elliott Wave Analysis of UnitedHealth Group (UNH): Stock Forecast, Wave 4 Completion, and Price Target at $650

This article provides an in-depth Elliott Wave analysis of UnitedHealth Group (UNH), covering both d...

Read More >
V300AEQ ETF UNITS – VAS Stock Analysis & Vanguard Elliott Wave Technical Forecast

V300AEQ ETF UNITS – VAS Stock Analysis & Vanguard Elliott Wave Technical Forecast

Our latest Elliott Wave analysis on ASX: V300AEQ ETF Units – VAS reveals that wave 2-red has conclu...

Read More >

$1 for 2 Weeks

then $29 a month!

What a Special Offer!

Trade Recommendations

Unleash the power of deversified trading with our comprehensive portfolio, covering 250+ markets:

  • Stock Trades
  • Crypto Trades
  • Forex Trades
  • Commodity Trades
Elliott Wave Analysis

Gain a competitive edge with expert insights and AI-powered Elliott Wave charting into:

  • Global Indices
  • US Stocks & ASX Stocks
  • Forex & Crypto
  • Commodities
Top-Notch Trading Tools

Equip yourself with the tools of success:

  • Real-time Chat rooms
  • Elliott Wave Algorithm
  • Portfolio tools
  • TradingLevels
  • Screener
  • Trading Game
7 Elliott Wave Analysts

Stay ahead of the market with daily charts and insightful videos
Your secret to strategic trading!

JOIN HERE


Welcome to TradingLounge (ASIC A.R.No. 321187), specialists in trades, trading education and technical analysis, covering stocks, indices, commodities, forex and cryptocurrencies.

When you join TradingLounge you have access to everything we offer, including trade tools, educational content and a social platform to chat with like-minded investors.

Read more

@Copyright 2024 by tradinglounge.com

Contact Us

Australian no: 02 4787 6020

International no: +61 (2) 47876020

Pay with:

Find us on