TradingLounge BTCUSD Elliott Wave Analysis for March 1, 2024
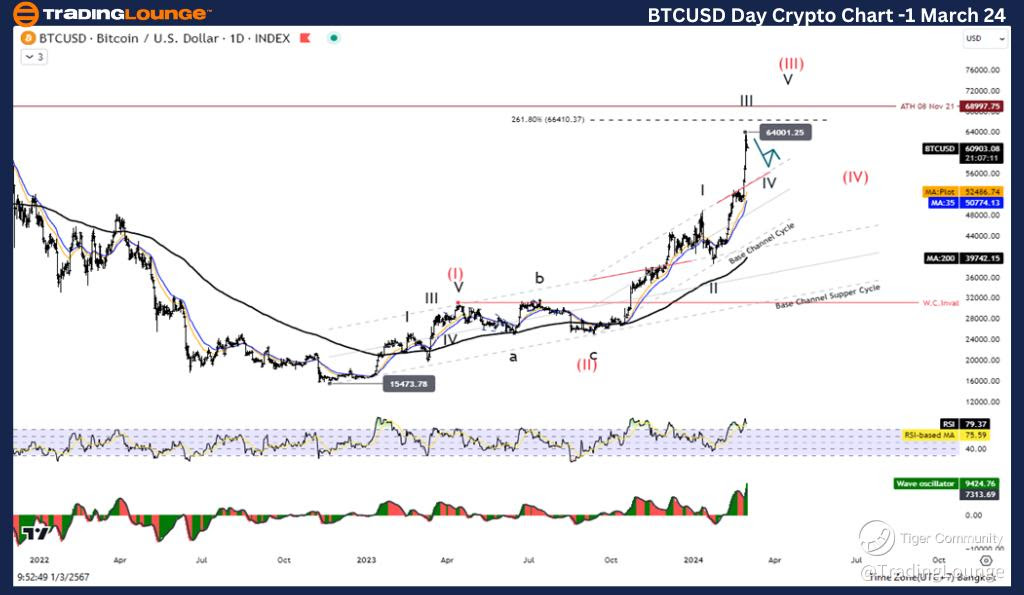
Daily Chart Analysis for Bitcoin/ U.S. Dollar(BTCUSD)
BTCUSD Elliott Wave Technical Analysis: Riding the Wave of Opportunity
Welcome to our daily Elliott Wave analysis for Bitcoin/ U.S. Dollar (BTCUSD). Today, we delve into the intricacies of Elliott Wave theory to navigate the current market trends and opportunities for traders.
Functionality: Embracing Trend Dynamics
Operational Mode: Motive Momentum
Structural Blueprint: Impulsive Momentum
Current Position: Wave III
Anticipated Direction in Higher Degrees: Continuing Wave (III)
Critical Level for Wave Cancellation: 31046.25
Bitcoin/ U.S. Dollar (BTCUSD) Trading Strategy:
The ongoing wave action (III) manifests as a potent impulse, presenting significant opportunities for upward movement, with a potential test of the 66410.307 level on the horizon. While short-term corrections in Wave IV may occur, they are expected to serve as temporary pauses before the resumption of the uptrend. Consequently, Bitcoin remains firmly entrenched in an upward trajectory, offering favorable prospects for traders.
Technical Insights for Bitcoin/ U.S. Dollar (BTCUSD):
Technical indicators underscore the bullish sentiment, with the price positioned above the crucial MA200 threshold, indicative of a sustained uptrend. Furthermore, Wave Oscillators corroborate this bullish momentum, reinforcing the outlook for continued upward movement.

Unlocking Opportunities: TradingLounge BTCUSD Elliott Wave Analysis
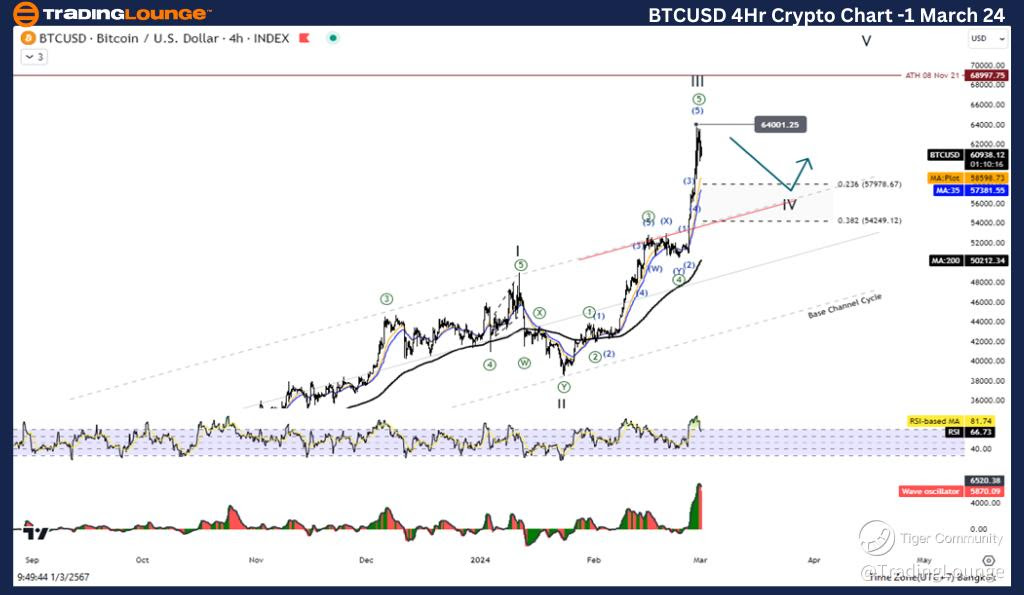
Bitcoin/U.S. Dollar(BTCUSD) 4-Hour Chart Analysis
BTCUSD Elliott Wave Technical Analysis:
Functionality: Navigating Trend Dynamics
Operational Mode: Energizing Motive Force
Structural Framework: Impulsive Motion
Current Position: Riding the Wave of III
Anticipated Direction in Higher Dimensions: Advancing Wave (III)
Critical Level for Wave Cancellation: 31046.25
Bitcoin/ U.S. Dollar (BTCUSD) Trading Strategy:
Within the realm of the 4-hour chart, the prevailing wave action (III) mirrors a robust impulse pattern, indicative of heightened momentum favoring upward movement. Prospects for an ascent towards the 66410.307 level remain promising. Short-term corrective movements in Wave IV are probable, serving as transient retracements before the resumption of the overarching uptrend. Thus, Bitcoin retains its bullish trajectory, presenting compelling opportunities for traders seeking to capitalize on market dynamics.
Technical Analysis for Bitcoin/ U.S. Dollar (BTCUSD):
Technical indicators continue to signal bullish momentum, with the price maintaining its position above the MA200 threshold, reinforcing the prevailing uptrend. Additionally, Wave Oscillators accentuate this bullish sentiment, underscoring the potential for sustained upward momentum.
In conclusion, our Elliott Wave analysis unveils a landscape ripe with opportunities for traders, as Bitcoin asserts its dominance with a resolute upward trajectory. By leveraging insights from Elliott Wave theory alongside robust technical indicators, traders can navigate the complexities of the market with confidence, poised to capitalize on emerging trends and capitalize on profitable opportunities.
For further analysis and real-time updates, stay tuned to TradingLounge for comprehensive insights into the dynamic world of Bitcoin trading.
Technical Analyst: Kittiampon Somboonsod, CEWA
Source: visit Tradinglounge.com and learn From the Experts Join TradingLounge Here
See Previous: Bitcoin/ U.S. dollar(BTCUSD)
TradingLounge Once Off SPECIAL DEAL: Here > 1 month Get 3 months.
