UnitedHealth Group Inc. (UNH) Elliott Wave Analysis: Trading Lounge Insights for March 20, 2024

Discover the latest insights into UnitedHealth Group Inc. (UNH) with our Elliott Wave analysis. Gain valuable perspectives on the daily and 4-hour charts, exploring potential trends and corrective movements for informed trading decisions.

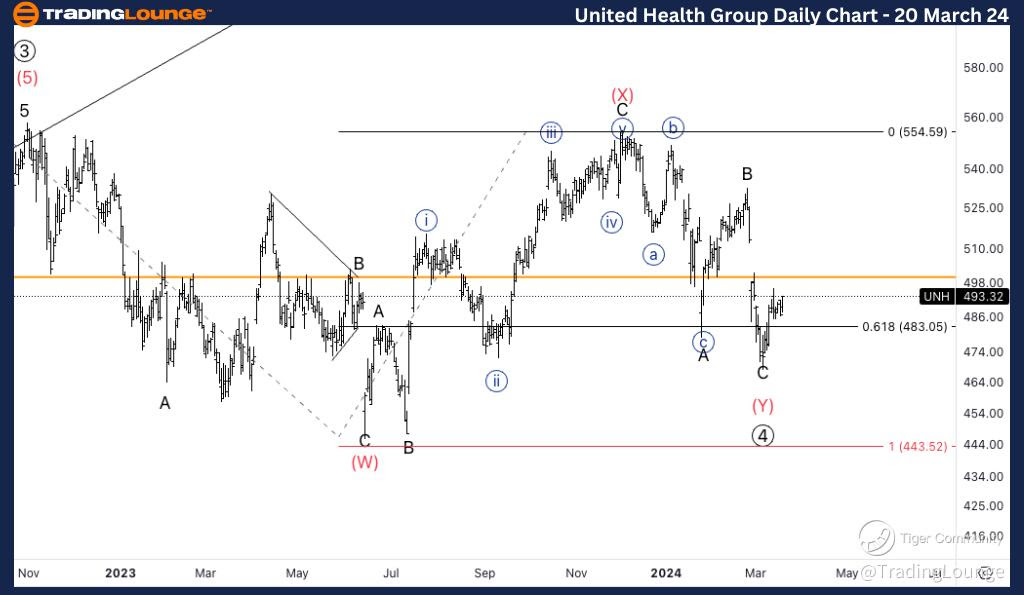
UnitedHealth Group Inc. (UNH) Daily Chart Analysis

Unlock the potential of the daily chart with our Elliott Wave technical analysis for UNH.

UNH Elliott Wave Technical Analysis Highlights:

Function: Counter Trend

Mode: Corrective

Structure: Complex

Position: Intermediate wave (Y)

Direction: Wave (Y) of 4

Insightful Details:

As we delve into the daily chart, our analysis suggests a counter-trend scenario with corrective movements characterized by a complex structure. Positioned within intermediate wave (Y), the current direction indicates Wave (Y) of 4.

Key Observations:

We're keenly observing a potential bottom formation in wave (Y). However, it's crucial to acknowledge the possibility of Wave (Y) evolving into Wave (C) of a triangle. Maintaining a price range fluctuating around $500 is pivotal, signalling potential upside movements in the future.

UnitedHealth-Day-Sto...


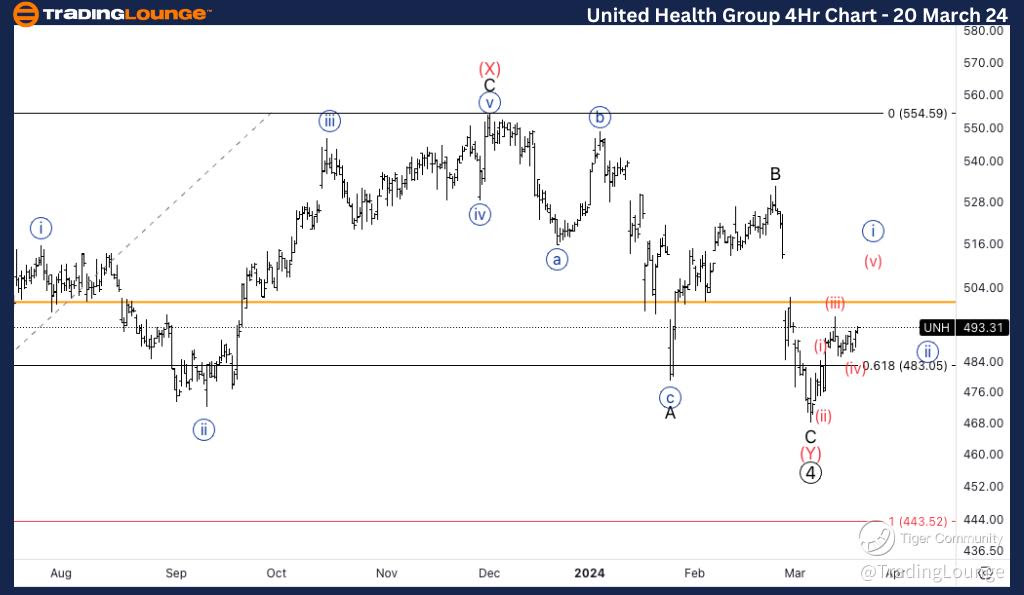
Trading Lounge UNH Elliott Wave Analysis 4Hr Chart, 20 March 24

UnitedHealth Group Inc. (UNH) 4Hr Chart Analysis

UNH Stock Analysis: Gain deeper insights into short-term trends with our Elliott Wave analysis on the 4-hour chart for UNH.

Elliott Wave Technical Analysis for UNH Highlights:

Function: Trend

Mode: Impulsive

Structure: Motive

Position: Minute wave {i}

Direction: Completion of wave {i}

Insightful Details:

Dive into the 4-hour chart, where our analysis points towards a trend-oriented scenario marked by impulsive movements. The structure exhibits a motive pattern, with the current position indicating Minute wave {i}.

Key Observations:

Exploring from the $468 bottom, there's potential for an impulsive move to unfold. Our focus lies on completing a five-wave sequence in wave {i}, anticipated to reach $500 before initiating a pullback in {ii}.

Incorporating Elliott Wave analysis into your trading strategy provides invaluable insights into potential price movements and trend developments for UnitedHealth Group Inc. (UNH). Stay ahead of the market with our comprehensive analysis, guiding you towards informed trading decisions.

Unlock the power of Elliott Wave analysis today and elevate your trading game with Trading Lounge.

Technical Analyst: Alessio Barretta

Source: visit Tradinglounge.com and learn From the Experts Join TradingLounge Here 

See Previous: Amazon.com Inc., (AMZN)

TradingLounge Once Off SPECIAL DEAL: Here > 1 month Get 3 months.

UnitedHealth-4Hr-Sto...

Related

ITC LTD Stock Elliott Wave Technical Analysis: Stay Updated on ITC investment Outlook and Trading Strategies

ITC LTD Stock Elliott Wave Technical Analysis: Stay Updated on ITC investment Outlook and Trading Strategies

This comprehensive analysis of ITC Ltd utilizes Elliott Wave Theory to assess stock trends and price...

Read More >
Swiss Market Index Elliott Wave Technical Analysis: Covers All Essential Aspects of SMI Trading  and Looking for Bullish Trends

Swiss Market Index Elliott Wave Technical Analysis: Covers All Essential Aspects of SMI Trading and Looking for Bullish Trends

This article thoroughly analyses the Swiss Market Index (SMI) using Elliott Wave theory, offering va...

Read More >
Elliott Wave Analysis: S&P 500, NASDAQ 100, DAX 40, FTSE 100 & ASX 200 – Key Market Trends & Trade Setups

Elliott Wave Analysis: S&P 500, NASDAQ 100, DAX 40, FTSE 100 & ASX 200 – Key Market Trends & Trade Setups

Elliott Wave Market Outlook & Trading Strategy The S&P 500 (SPX) and NASDAQ 100 (NDX) are in an A-B...

Read More >
Maximize Gains with Expert NASDAQ Elliott Wave Analysis and Trading Strategies

Maximize Gains with Expert NASDAQ Elliott Wave Analysis and Trading Strategies

Explore our expert Elliott Wave Analysis and trading strategies for NASDAQ 100 (NDX) and leading tec...

Read More >
ASX Trading Wisetech Global Limited Stock Analysis & WTC Elliott Wave Technical Forecast to Enhance your Trading Strategy

ASX Trading Wisetech Global Limited Stock Analysis & WTC Elliott Wave Technical Forecast to Enhance your Trading Strategy

Stay ahead in the market with our comprehensive Elliott Wave analysis of Wisetech Global Limited (WT...

Read More >
Tech Stock Forecast: AAPL, NVDA, AMZN Lead While TSLA, MSFT, GOOGL Lag...

Tech Stock Forecast: AAPL, NVDA, AMZN Lead While TSLA, MSFT, GOOGL Lag...

The Elliott Wave analysis indicates an upward movement (Wave (ii) of iii)) for the SP500 and NASDAQ ...

Read More >

Buy 1 Month

Get 3 Months!

Special Offer:

Trade Recommendations

Unleash the power of deversified trading with our comprehensive portfolio, covering:

  • Stock Trades
  • Crypto Trades
  • Forex Trades
  • Commodity Trades
Elliott Wave Analysis

Gain a competive edge with expert insights in to:

  • Global Indices
  • US Stocks & ASX Stocks
  • Forex & Crypto
  • Commodities
Top-Notch Trading Tools

Equip yourself with the tools of success:

  • Social Chat
  • Elliott Wave Algorithm
  • Screener
  • TradingLevels
  • Trading Game
7 Elliott Wave Analysts

Stay ahead of the market with daily charts and insightful videos
-Your secret to strategic trading!

JOIN HERE


Welcome to TradingLounge (ASIC A.R.No. 321187), specialists in trades, trading education and technical analysis, covering stocks, indices, commodities, forex and cryptocurrencies.

When you join TradingLounge you have access to everything we offer, including trade tools, educational content and a social platform to chat with like-minded investors.

Read more

@Copyright 2024 by tradinglounge.com

Contact Us

Australian no: 02 4787 6020

International no: +61 (2) 47876020

Pay with:

Find us on