AMZN Elliott Wave Analysis Trading Lounge Daily Chart
In our daily examination of Amazon.com Inc.'s (AMZN) market trends, the Elliott Wave theory offers insightful analysis, shedding light on potential trading opportunities. Let's delve into the intricacies of the Elliott Wave patterns observed in AMZN's daily and 4-hour charts.
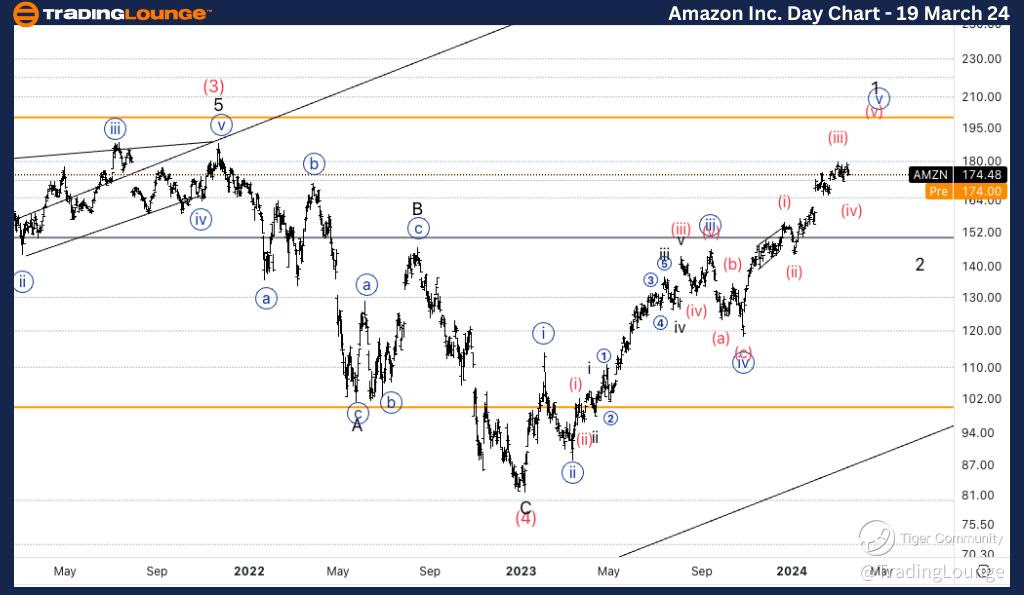
Amazon.com Inc., (AMZN) Daily Chart Analysis
AMZN Elliott Wave Technical Analysis
Functional Aspect: Trend Analysis
In the daily chart analysis of AMZN, the Elliott Wave pattern suggests a predominant impulsive trend, indicating a strong directional movement in the market.
Mode Identification: Impulsive Behavior
The observed pattern reflects an impulsive mode, signifying a decisive and forceful movement in the market direction.
Structural Configuration: Motive Wave
The structural analysis highlights a motive wave pattern, emphasizing the underlying driving force behind the observed market movement.
Wave Positioning: Intermediate Wave (5)
Within the Elliott Wave framework, the current positioning indicates an intermediate wave labelled as wave (5), suggesting a significant phase within the broader market trend.
Directional Insight: Wave 1 of (5)
Our analysis indicates the ongoing movement as potentially constituting wave 1 of (5), marking a bullish momentum in the market trajectory.
Detailed Examination:
As the market approaches its all-time high (ATH), there's a consideration that the movement from the $80 bottom forms a part of the wave (5). Even in the most pessimistic scenarios, one could argue against this being wave 1 of (5) but rather wave (5) itself.
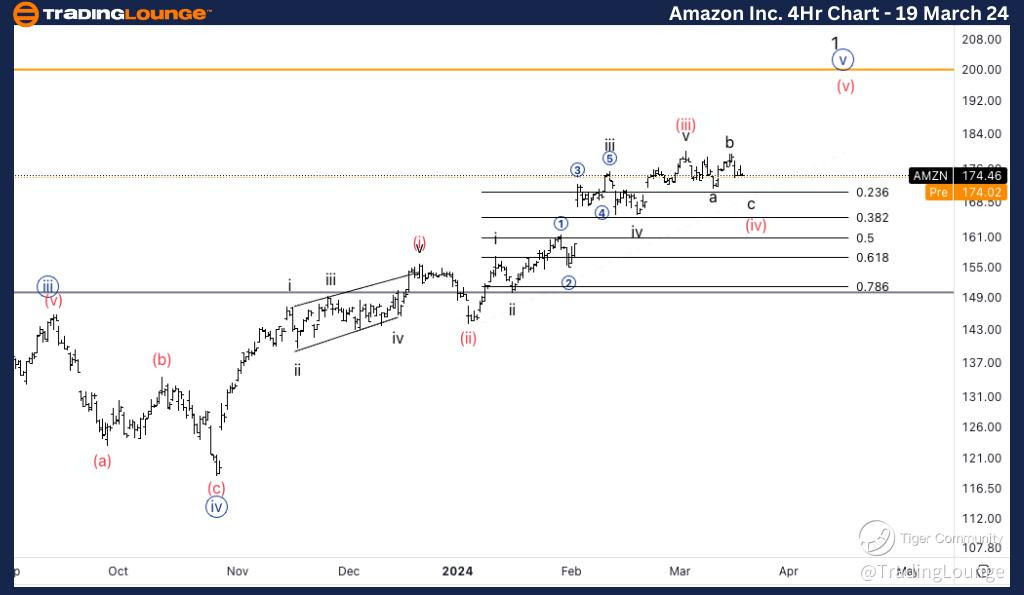
AMZN Elliott Wave Analysis Trading Lounge 4Hr Chart
Amazon.com Inc., (AMZN) 4Hr Chart Analysis
Elliott Wave Technical Analysis of AMZN
Functional Aspect: Trend Analysis
On the 4-hour chart of AMZN, our Elliott Wave analysis provides further insights into the market trend, aiding in strategic decision-making.
Mode Identification: Impulsive Behavior
Similar to the daily chart, the 4-hour analysis indicates an impulsive mode, suggesting a pronounced directional movement in the market.
Structural Configuration: Motive Wave
The structural examination reiterates the presence of a motive wave pattern, emphasizing the driving force behind the observed market behaviour.
Wave Positioning: Minor Wave 1
Within the 4-hour timeframe, the current positioning denotes a minor wave labelled as wave 1, depicting a smaller yet significant phase within the broader market trend.
Directional Insight: Minute Wave {v} of 1
Our analysis identifies the ongoing movement as minute wave {v} of 1, highlighting a specific sub-wave within the minor wave structure.
Detailed Examination:
In anticipation of further downside movement, we're looking for a continuation lower into wave (iv), suggesting a corrective phase in the market. The search for support around the 38.2% Fibonacci retracement level is underway, with a subsequent target set at TL2, estimated at $200.
By leveraging the insights garnered from Elliott Wave analysis, traders can devise informed strategies, navigating the complexities of the market landscape with confidence. Stay tuned for more updates on AMZN's evolving Elliott Wave patterns and potential trading opportunities.
Technical Analyst: Alessio Barretta
Source: visit Tradinglounge.com and learn From the Experts Join TradingLounge Here
See Previous: Texas Instruments Inc., (TXN)
TradingLounge Once Off SPECIAL DEAL: Here > 1 month Get 3 months.