Soybeans Commodity Elliott Wave Analysis

Soybeans Elliott Wave Technical Analysis

Soybeans broke to the downside on December 17, marking a continuation of the bearish trend initiated in June 2022 when prices peaked above $1,785. The current price hovers around $950, with the potential to fall further toward $800 in the coming days or weeks.

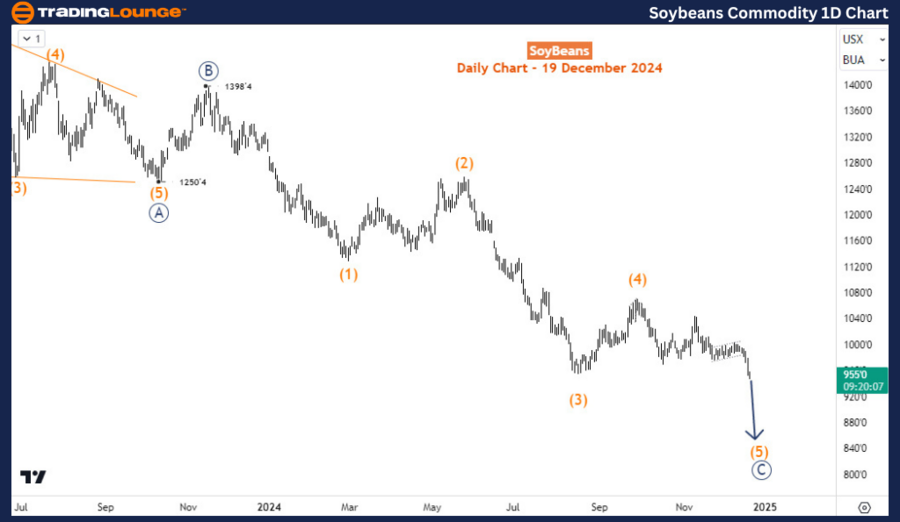
Soybeans Commodity Daily Chart Analysis

The daily chart highlights that the bearish cycle from June 2022 is a corrective structure rather than an impulsive one. Wave ((A)) was completed in October 2023 at $1,250, followed by a bounce to $1,398 for wave ((B)) in November 2023. The ongoing wave ((C)) is unfolding with an incomplete impulsive structure and is now in its final wave – wave (5). This bearish correction since June 2022 retraces the prior bullish impulse wave that began in May 2019 and culminated in June 2022.

Further analysis on the H4 chart provides insights into the progression of wave (5) and its potential targets.

Soybeans-Commodity-1...


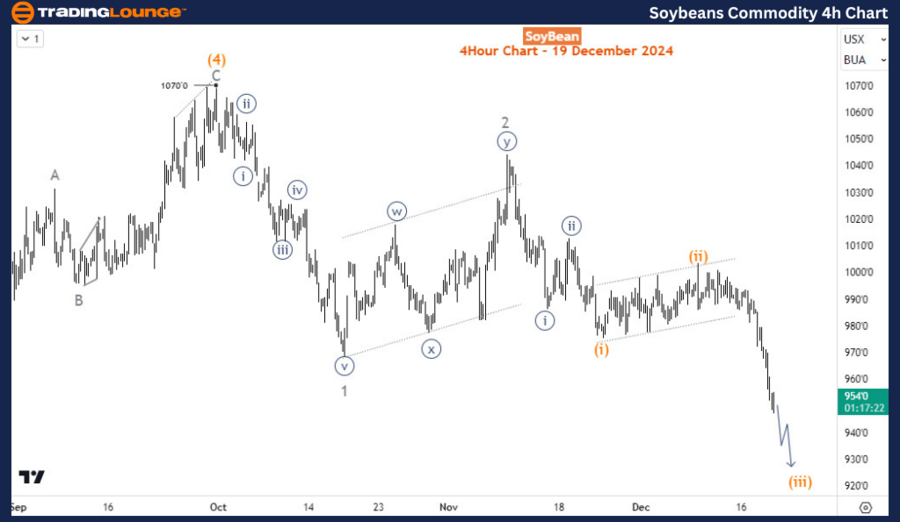
Soybeans Commodity H4 Chart Analysis

Wave (5) of the bearish cycle has progressed through waves 1 and 2 and is currently in wave 3. Wave 3 remains incomplete and is currently in wave (iii) of ((iii)) of 3. This indicates that further downside is likely before wave (5) concludes. Additionally, there is a possibility of an alternative scenario, where an ending diagonal structure could complete wave (5) instead of an impulse. Regardless of the pattern, the short-term outlook favors further declines, making selling opportunities on bounces a strategic approach for traders.

Technical Analyst: Sanmi Adeagbo

Source: visit Tradinglounge.com and learn From the Experts Join TradingLounge Here 

See Previous: WTI Crude Oil Elliott Wave Technical Analysis

VALUE Offer - Buy 1 Month & Get 3 Months!Click here

Access 7 Analysts Over 200 Markets Covered. Chat Room With Support

Soybeans-Commodity-4...

Related

Comprehensive Elliott Wave Market Analysis: S&P 500, NASDAQ 100, RUSSELL 2000, DAX 40, FTSE 100, ASX 200 Insights

Comprehensive Elliott Wave Market Analysis: S&P 500, NASDAQ 100, RUSSELL 2000, DAX 40, FTSE 100, ASX 200 Insights

In our latest analysis leveraging the Elliott Wave framework, we advise investors to progressively a...

Read More >
in-depth Analysis and Trading Strategies S&P/ASX 200 Indices Elliott Wave Technical Analysis

in-depth Analysis and Trading Strategies S&P/ASX 200 Indices Elliott Wave Technical Analysis

Stay ahead in the S&P/ASX 200 market with our in-depth analysis and trading strategies. Our comprehe...

Read More >
BTCUSD Forecast: Elliott Wave Technical  Analysis and Key Signals for Bitcoin’s Uptrend

BTCUSD Forecast: Elliott Wave Technical Analysis and Key Signals for Bitcoin’s Uptrend

Gain valuable insights into Bitcoin's (BTCUSD) current market trends with Elliott Wave analysis....

Read More >
Unlocking ASX Trading Success: NEWMONT CORPORATION - NEM Stock Analysis & Elliott Wave Technical Forecast

Unlocking ASX Trading Success: NEWMONT CORPORATION - NEM Stock Analysis & Elliott Wave Technical Forecast

This article provides an in-depth Elliott Wave technical analysis for Newmont Corporation (NEM) list...

Read More >
Tech Mahindra Stocks Elliott Wave Technical Analysis: Insights into Potential Stock Movements and Price Predictions

Tech Mahindra Stocks Elliott Wave Technical Analysis: Insights into Potential Stock Movements and Price Predictions

This article provides a comprehensive Elliott Wave analysis of Tech Mahindra, offering insights into...

Read More >

Buy 1 Month

Get 3 Months!

Special Offer:

Trade Recommendations

Unleash the power of deversified trading with our comprehensive portfolio, covering:

  • Stock Trades
  • Crypto Trades
  • Forex Trades
  • Commodity Trades
Elliott Wave Analysis

Gain a competive edge with expert insights in to:

  • Global Indices
  • US Stocks & ASX Stocks
  • Forex & Crypto
  • Commodities
Top-Notch Trading Tools

Equip yourself with the tools of success:

  • Social Chat
  • Elliott Wave Algorithm
  • Screener
  • TradingLevels
  • Trading Game
7 Elliott Wave Analysts

Stay ahead of the market with daily charts and insightful videos
-Your secret to strategic trading!

JOIN HERE


Welcome to TradingLounge (ASIC A.R.No. 321187), specialists in trades, trading education and technical analysis, covering stocks, indices, commodities, forex and cryptocurrencies.

When you join TradingLounge you have access to everything we offer, including trade tools, educational content and a social platform to chat with like-minded investors.

Read more

@Copyright 2024 by tradinglounge.com

Contact Us

Australian no: 02 4787 6020

International no: +61 (2) 47876020

Pay with:

Find us on