TradingLounge WTI Crudeoil Elliott Wave Technical Analysis

WTI Elliott Wave Analysis

Function - Counter-trend for wave 2

Mode - Corrective

Structure - Impulse for wave a of 2

Position - Wave 3

Direction - Wave 3 is in play

Details - The count still shows a downward trend for wave 3, following the commodity's drop below 80.29. The outlook remains bearish, targeting a range of 75-76 at a minimum.

Recent Movements in WTI Crude Oil Market
The recent activity in the WTI Crude Oil market points to a continuation of the bearish trend initiated in April 2024. The commodity has been erasing the gains seen since June 2024, experiencing a decline of approximately 60%. This pattern indicates a potential reversal rather than a mere correction, suggesting that WTI may continue to drop. The long-term perspective also remains bearish, with the corrective decline from March 2022 expected to extend below the March 2023 low, potentially reaching the $50 range. The ongoing decline from early July 2024 fits within this long-term bearish framework, provided the resistance at 87.63 holds.

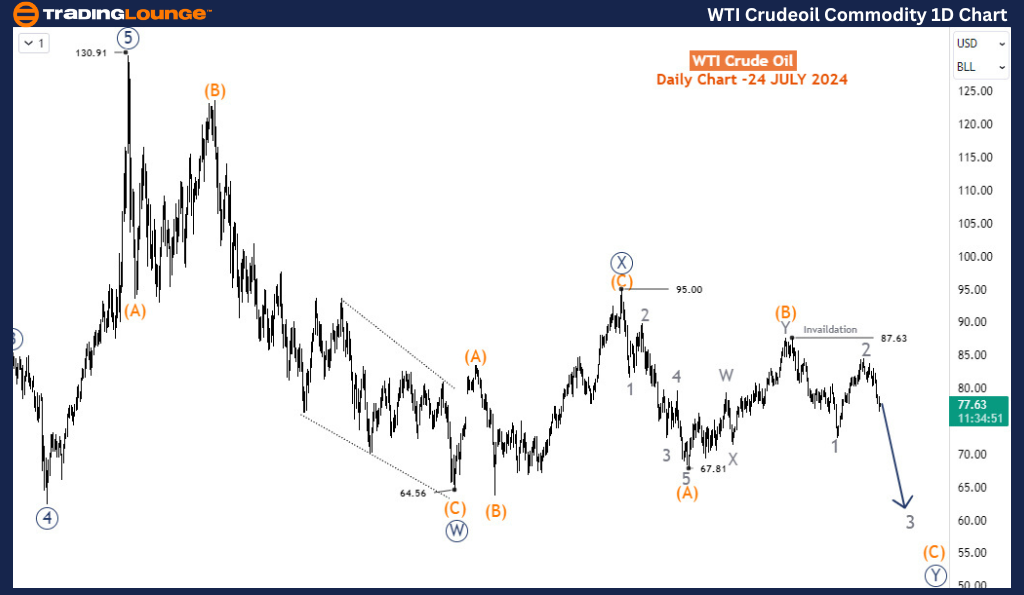
WTI Crude Oil Daily Chart Analysis

The daily chart reveals a corrective structure starting from March 2022, where WTI peaked near $131. The first phase of this corrective cycle concluded at $64.5 in March 2023, marking wave W (circled) of the primary degree. This was followed by a corrective wave X (circled), ending at $95 in September 2023. The third leg of the bearish cycle, wave Y (circled), then began. Within wave Y, waves (A) and (B) completed at 67.81 in December 2023 and 87.63 in April 2024, respectively. Wave (C) started from 87.63 and is expected to decline in a 5-wave structure. Waves 1 and 2 of (C) seem to have been completed, with the current decline marking wave 3 of (C). Projections suggest that wave 3 could reach $61 or lower before encountering significant support.

WTI-Crudeoil-Commodi...


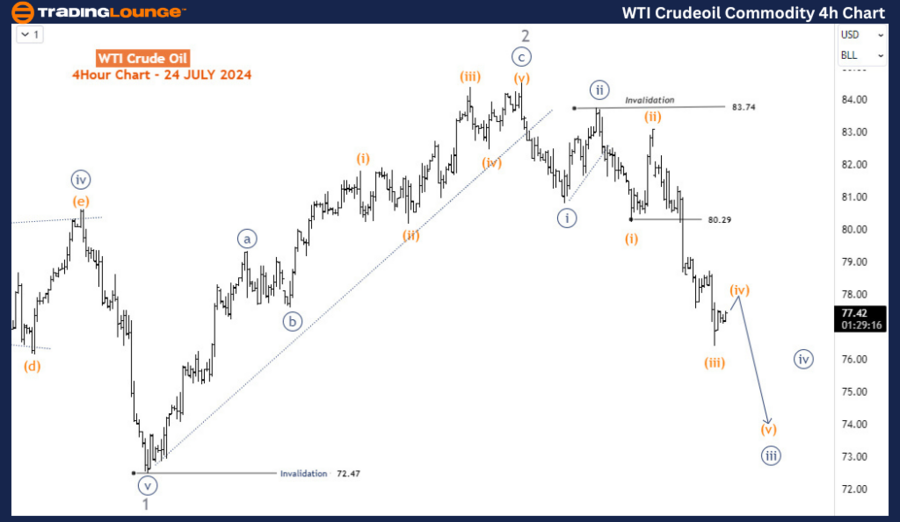
WTI Crude Oil H4 Chart Analysis

The H4 chart focuses on the sub-waves of wave 3. Currently, the price is in the third wave, wave iii (circled) of 3. This indicates that wave 3 still has significant potential to move lower. As a result, the market conditions favor sellers, who might consider taking positions during corrective bounces.

Summary
The Elliott Wave analysis for WTI Crude Oil suggests a continuation of the bearish trend. Key levels to monitor include support at $61 and resistance at 87.63. Both long-term and short-term analyses point to further declines, with wave 3 of (C) expected to reach $61 or lower. Traders should remain cautious and look for selling opportunities during corrective bounces. By keeping an eye on wave structures and key price levels, traders can better anticipate future movements in the WTI Crude Oil market and make informed decisions.

Technical Analyst: Sanmi Adeagbo

Source: visit Tradinglounge.com and learn From the Experts Join TradingLounge Here 

See Previous: Iron Ore Elliott Wave Technical Analysis

Special Trial Offer - 0.76 Cents a Day for 3 Months! Click here

Access 7 Analysts Over 170 Markets Covered. Chat Room With Support

WTI-Crudeoil-Commodi...

Related

EURUSD Elliott Wave Technical Analysis Reveals Wave 4 Correction Nearing End, Setting Stage for Bullish Wave 5 Breakout Ahead

EURUSD Elliott Wave Technical Analysis Reveals Wave 4 Correction Nearing End, Setting Stage for Bullish Wave 5 Breakout Ahead

EURUSD Elliott Wave Technical Analysis shows a corrective wave 4 structure on both daily and 4-hour ...

Read More >
DOTUSD Elliott Wave Analysis: Polkadot Price Prediction, Trading Strategy, Market Trends, Support and Resistance Levels Insights

DOTUSD Elliott Wave Analysis: Polkadot Price Prediction, Trading Strategy, Market Trends, Support and Resistance Levels Insights

DOTUSD Elliott Wave analysis offers valuable insights into Polkadot's price prediction, trading ...

Read More >
S&P/TSX 60 Index Elliott Wave Technical Analysis Shows Reinforcing the overall Bullish Outlook in both Daily and Weekly Charts

S&P/TSX 60 Index Elliott Wave Technical Analysis Shows Reinforcing the overall Bullish Outlook in both Daily and Weekly Charts

The S&P/TSX 60 is in a bullish trend, according to Elliott Wave analysis. Gray wave 2 of orange wave...

Read More >
DOW JONES Market Analysis - DJI Index Elliott Wave Technical Analysis | Dow Jones Stocks financial news

DOW JONES Market Analysis - DJI Index Elliott Wave Technical Analysis | Dow Jones Stocks financial news

This analysis provides an in-depth look at the Dow Jones DJI using Elliott Wave theory on day and we...

Read More >
Elliott Wave Analysis: S&P 500, NASDAQ 100, DAX 40, FTSE 100, ASX 200.

Elliott Wave Analysis: S&P 500, NASDAQ 100, DAX 40, FTSE 100, ASX 200.

TradingLounge delivers expert Elliott Wave analysis and actionable trading setups across key indices...

Read More >
McDonald’s Corp.(MCD:NYSE) Elliott Wave Technical Analysis 25 January 24

McDonald’s Corp.(MCD:NYSE) Elliott Wave Technical Analysis 25 January 24

McDonald’s Corp.(MCD: NYSE) Elliot Wave Technical Analysis 1-Hour and 4-Hour Chart of dated 25 Janu...

Read More >

$1 for 2 Weeks

then $29 a month!

What a Special Offer!

Trade Recommendations

Unleash the power of deversified trading with our comprehensive portfolio, covering 250+ markets:

  • Stock Trades
  • Crypto Trades
  • Forex Trades
  • Commodity Trades
Elliott Wave Analysis

Gain a competitive edge with expert insights and AI-powered Elliott Wave charting into:

  • Global Indices
  • US Stocks & ASX Stocks
  • Forex & Crypto
  • Commodities
Top-Notch Trading Tools

Equip yourself with the tools of success:

  • Real-time Chat rooms
  • Elliott Wave Algorithm
  • Portfolio tools
  • TradingLevels
  • Screener
  • Trading Game
7 Elliott Wave Analysts

Stay ahead of the market with daily charts and insightful videos
Your secret to strategic trading!

JOIN HERE


Welcome to TradingLounge (ASIC A.R.No. 321187), specialists in trades, trading education and technical analysis, covering stocks, indices, commodities, forex and cryptocurrencies.

When you join TradingLounge you have access to everything we offer, including trade tools, educational content and a social platform to chat with like-minded investors.

Read more

@Copyright 2024 by tradinglounge.com

Contact Us

Australian no: 02 4787 6020

International no: +61 (2) 47876020

Pay with:

Find us on