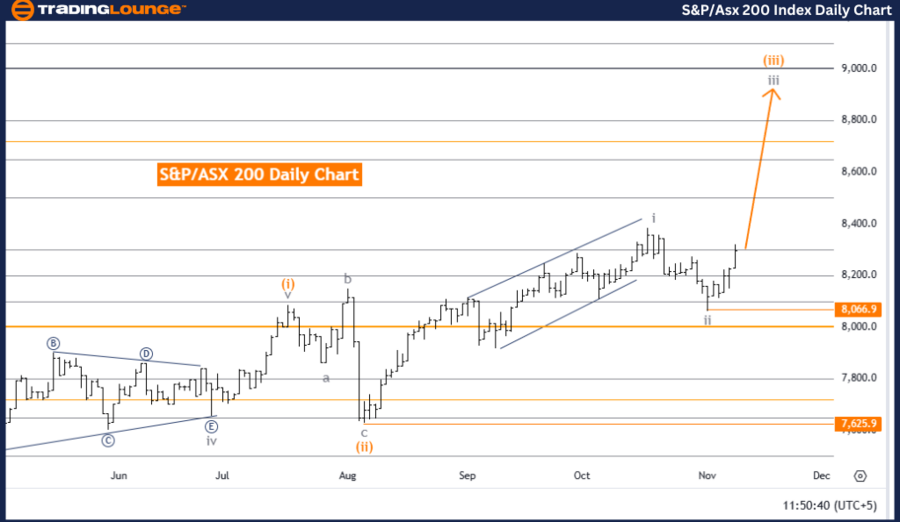
S&P/ASX 200 Elliott Wave Analysis Trading Lounge Day Chart

S&P/ASX 200 Elliott Wave Technical Analysis

FUNCTION: Bullish Trend

MODE: Impulsive

STRUCTURE: Gray Wave 3

POSITION: Orange Wave 3

DIRECTION NEXT HIGHER DEGREES: Gray Wave 3 (initiated)

DETAILS: Gray Wave 2 appears completed, with Gray Wave 3 now in progress.

Wave Cancel Invalid Level: 7,066.9

The S&P/ASX 200 Day Chart Elliott Wave Analysis highlights a bullish trend forming in an impulsive mode, actively unfolding within Gray Wave 3. Following the apparent conclusion of Gray Wave 2, the chart now shows the emergence of Gray Wave 3, a phase typically associated with strong upward momentum.

Key Insights:

  • Wave 3 Dynamics: According to Elliott Wave Theory, Wave 3 often signifies the most dynamic and forceful stage of an impulsive trend, characterized by rapid price movement.

  • Positioning: The market is positioned within Orange Wave 3 of Gray Wave 3, which further emphasizes the impulsive nature of this phase and suggests a sustained upward trajectory.
  • Corrective Dips: Given the robust momentum in Gray Wave 3, any short-term pullbacks are expected to be shallow, reinforcing the bullish outlook.

Critical Levels:

  • Invalidation Threshold: The bullish wave structure remains valid as long as prices stay above 7,066.9. A breach of this level would necessitate a reevaluation of the current wave count.

Summary:

The S&P/ASX 200 Day Chart analysis confirms a strong bullish trend, progressing in an impulsive Gray Wave 3 phase. Positioned in Orange Wave 3, the market is primed for further gains with minimal corrections, consistent with a typical Wave 3 scenario. The 7,066.9 invalidation level serves as a pivotal marker, ensuring the current wave structure remains intact.

S&P-ASX-200-Index-Da...


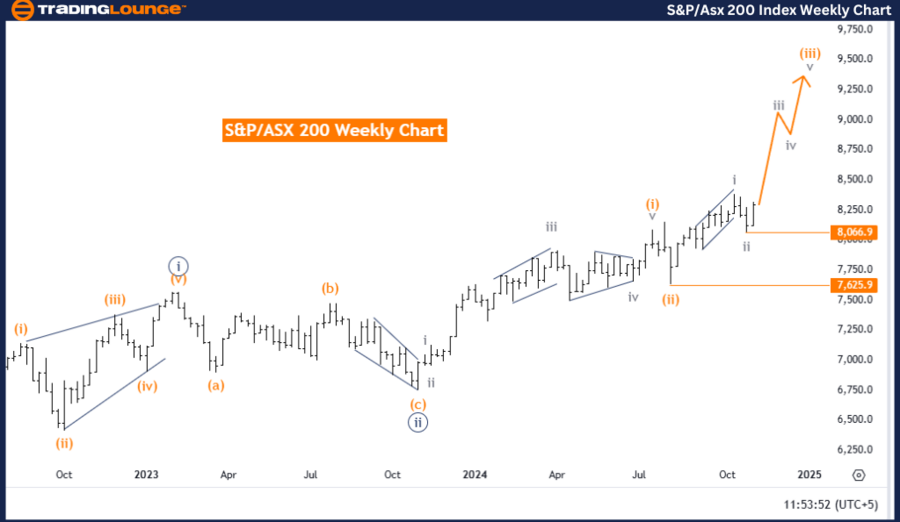
S&P/ASX 200 Elliott Wave Analysis Trading Lounge Weekly Chart

S&P/ASX 200 Elliott Wave Technical Analysis

FUNCTION: Bullish Trend

MODE: Impulsive

STRUCTURE: Gray Wave 3

POSITION: Orange Wave 3

DIRECTION NEXT HIGHER DEGREES: Gray Wave 3 (initiated)

DETAILS: Gray Wave 2 appears completed, with Gray Wave 3 now active.

Wave Cancel Invalid Level: 7,066.9

The S&P/ASX 200 Weekly Chart Elliott Wave Analysis indicates a bullish trend, driven by an impulsive pattern in Gray Wave 3. The completion of Gray Wave 2 has set the stage for the ongoing development of Gray Wave 3, reflecting strong directional momentum.

Key Insights:

  • Wave 3 Characteristics: In Elliott Wave Theory, Wave 3 is often the most dominant phase in an impulsive sequence, showcasing robust price action and sustained buying pressure.

  • Orange Wave 3 Role: Within Gray Wave 3, Orange Wave 3 signifies heightened investor confidence and increased upward movement, typically leading to the formation of new highs.
  • Minor Pullbacks: Any corrective dips during this phase are expected to be brief and shallow, aligning with the bullish momentum.

Critical Levels:

  • Invalidation Threshold: The bullish trend remains intact as long as the price holds above 7,066.9. A drop below this level would invalidate the current wave structure and prompt a reassessment of the count.

Summary:

The S&P/ASX 200 Weekly Chart analysis supports a bullish trend within an impulsive Gray Wave 3 phase. Positioned in Orange Wave 3, the chart signals ongoing upward momentum with the potential for significant gains. The 7,066.9 invalidation level acts as a critical support level, ensuring the wave count's validity and reinforcing the bullish outlook.

Technical Analyst: Malik Awais

Source: visit Tradinglounge.com and learn From the Experts Join TradingLounge Here 

Previous: CAC 40 Index Elliott Wave Technical Analysis

VALUE Offer - Buy 1 Month & Get 3 Months!Click here

Access 7 Analysts Over 200 Markets Covered. Chat Room With Support

S&P-ASX-200-Index-We...

Related

Understanding of the EURUSD's Forecast, Counter-Trend Movements, and Potential Market Shifts: EURUSD Elliott Wave Analysis

Understanding of the EURUSD's Forecast, Counter-Trend Movements, and Potential Market Shifts: EURUSD Elliott Wave Analysis

This EURUSD Elliott Wave analysis offers an in-depth view of the Euro Dollar's corrective wave p...

Read More >
Learn about Ethereum's Crypto Price uptrend and downtrend indicators: ETHUSD Elliott Wave Technical Analysis

Learn about Ethereum's Crypto Price uptrend and downtrend indicators: ETHUSD Elliott Wave Technical Analysis

This analysis provides a detailed overview of Ethereum price prediction using Elliott Wave Theory. I...

Read More >
Insights into BTCUSD price prediction and trading strategies: Bitcoin Crypto Price News Today Elliott Wave Technical Analysis

Insights into BTCUSD price prediction and trading strategies: Bitcoin Crypto Price News Today Elliott Wave Technical Analysis

This article provides an in-depth BTCUSD Elliott Wave analysis, offering insights into Bitcoin price...

Read More >
Binance Coin Crypto News Today: Elliott Wave Technical Analysis of BNB/USD Navigating the Bullish Momentum

Binance Coin Crypto News Today: Elliott Wave Technical Analysis of BNB/USD Navigating the Bullish Momentum

Dive into the world of cryptocurrency with our detailed Elliott Wave analysis of BNB/USD. This guide...

Read More >
Amazon Stock Elliott Wave Analysis: AMZN Forecast Shows Corrective Zigzag Pattern with $159 Price Target and Potential Reversal Ahead

Amazon Stock Elliott Wave Analysis: AMZN Forecast Shows Corrective Zigzag Pattern with $159 Price Target and Potential Reversal Ahead

Elliott Wave analysis of Amazon (AMZN) stock using daily and hourly charts. It identifies a correcti...

Read More >
Lululemon Athletica Inc. (LULU) Elliott Wave Analysis: Stock Forecast and Trading Opportunities with Key Support & Resistance Levels

Lululemon Athletica Inc. (LULU) Elliott Wave Analysis: Stock Forecast and Trading Opportunities with Key Support & Resistance Levels

Lululemon stock analysis provides an in-depth LULU Elliott Wave forecast, identifying key price move...

Read More >

$1 for 2 Weeks

then $29 a month!

What a Special Offer!

Trade Recommendations

Unleash the power of deversified trading with our comprehensive portfolio, covering 250+ markets:

  • Stock Trades
  • Crypto Trades
  • Forex Trades
  • Commodity Trades
Elliott Wave Analysis

Gain a competitive edge with expert insights and AI-powered Elliott Wave charting into:

  • Global Indices
  • US Stocks & ASX Stocks
  • Forex & Crypto
  • Commodities
Top-Notch Trading Tools

Equip yourself with the tools of success:

  • Real-time Chat rooms
  • Elliott Wave Algorithm
  • Portfolio tools
  • TradingLevels
  • Screener
  • Trading Game
7 Elliott Wave Analysts

Stay ahead of the market with daily charts and insightful videos
Your secret to strategic trading!

JOIN HERE


Welcome to TradingLounge (ASIC A.R.No. 321187), specialists in trades, trading education and technical analysis, covering stocks, indices, commodities, forex and cryptocurrencies.

When you join TradingLounge you have access to everything we offer, including trade tools, educational content and a social platform to chat with like-minded investors.

Read more

@Copyright 2024 by tradinglounge.com

Contact Us

Australian no: 02 4787 6020

International no: +61 (2) 47876020

Pay with:

Find us on