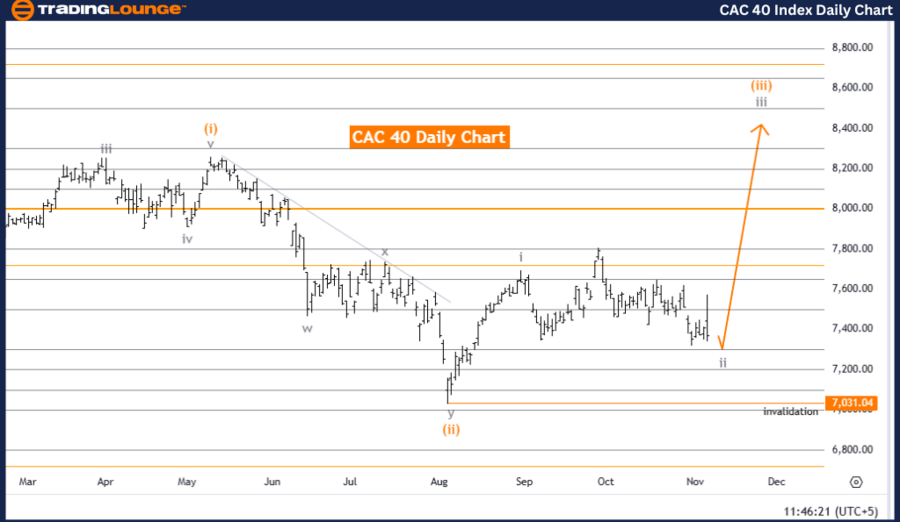
CAC 40 (France) Elliott Wave Analysis Trading Lounge Day Chart
CAC 40 Elliott Wave Technical Analysis
Function: Counter Trend
Mode: Corrective
Structure: Gray Wave 2
Position: Orange Wave 3
Next Higher Degree Direction: Gray Wave 3
Details: Gray Wave 1 is completed, and Gray Wave 2 of Orange Wave 3 is currently unfolding.
Wave Cancellation Level: 7,031.04
The CAC 40 day chart Elliott Wave analysis reveals a counter-trend movement in a corrective mode, with a focus on Gray Wave 2. Positioned within the larger Orange Wave 3, the analysis points to the completion of Gray Wave 1, with Gray Wave 2 actively unfolding in Orange Wave 3. This phase in Gray Wave 2 signals a potential pullback or consolidation against the primary trend, which could precede a continuation of the upward momentum in Orange Wave 3.
The invalidation level is set at 7,031.04, acting as a crucial threshold for the current wave structure. As long as prices remain above this level, the corrective phase of Gray Wave 2 holds, supporting a likely return to the primary upward trend under Gray Wave 3. Should prices fall below this level, however, it would invalidate the existing wave analysis, suggesting a potential shift in the counter-trend perspective.
The positioning of Gray Wave 2 within Orange Wave 3 highlights a corrective phase in the overall trend. With Gray Wave 1 concluded, the corrective nature of Gray Wave 2 may offer reversal opportunities before a possible continuation of the primary trend. Traders and analysts monitoring the CAC 40 may view this phase as a temporary pullback opportunity, keeping an eye on the 7,031.04 level to ensure alignment with the wave structure.
In summary, the CAC 40 day chart Elliott Wave analysis points to an active counter-trend corrective phase, with Gray Wave 2 positioned within Orange Wave 3. The analysis suggests potential consolidation or pullback ahead of a resumption of the primary trend. The 7,031.04 level is a key threshold; maintaining prices above this level confirms the end of the corrective phase and the preservation of the wave structure.
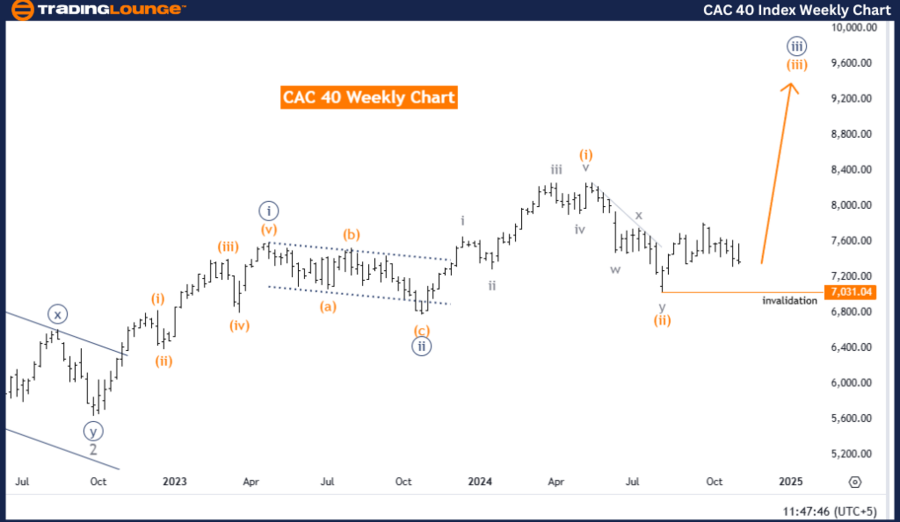
CAC 40 (France) Elliott Wave Analysis Trading Lounge Weekly Chart
CAC 40 Elliott Wave Technical Analysis
Function: Bullish Trend
Mode: Impulsive
Structure: Orange Wave 3
Position: Navy Blue Wave 3
Next Higher Degree Direction: Orange Wave 3 (Initiated)
Details: Orange Wave 2 has completed, with Orange Wave 3 now active.
Wave Cancellation Level: 7,031.04
The CAC 40 weekly chart Elliott Wave analysis indicates a bullish trend in an impulsive mode, highlighting the progression of Orange Wave 3. Within this structure, Navy Blue Wave 3 is advancing, in alignment with the recently initiated Orange Wave 3. This suggests the completion of Orange Wave 2, with the CAC 40 index now poised for an upward movement within Orange Wave 3.
The development of Orange Wave 3 reinforces the primary bullish trend, reflecting sustained market momentum. With Orange Wave 2 now concluded, Orange Wave 3 is anticipated to extend the upward trajectory, suggesting a positive outlook for the CAC 40 index within the broader wave structure.
The wave invalidation level is established at 7,031.04, serving as critical support for the ongoing bullish pattern. Should prices remain above this level, the analysis favors a continuation of the upward trend, affirming the progression of Orange Wave 3. However, a dip below this threshold would negate the current wave structure, potentially prompting a reassessment of the bullish outlook.
In summary, the CAC 40 weekly chart analysis indicates a bullish trend in an impulsive wave structure driven by Orange Wave 3. Following Orange Wave 2’s completion, the chart projects a strong upward movement within Orange Wave 3, aligned with the broader bullish wave pattern. The 7,031.04 level remains a vital support, sustaining the current trend as long as prices stay above it, suggesting continued growth potential for the CAC 40 index within the established Elliott Wave framework.
Technical Analyst: Malik Awais
Source: visit Tradinglounge.com and learn From the Experts Join TradingLounge Here
Previous: Swiss Market Index Elliott Wave Technical Analysis
VALUE Offer - Buy 1 Month & Get 3 Months!Click here
Access 7 Analysts Over 200 Markets Covered. Chat Room With Support