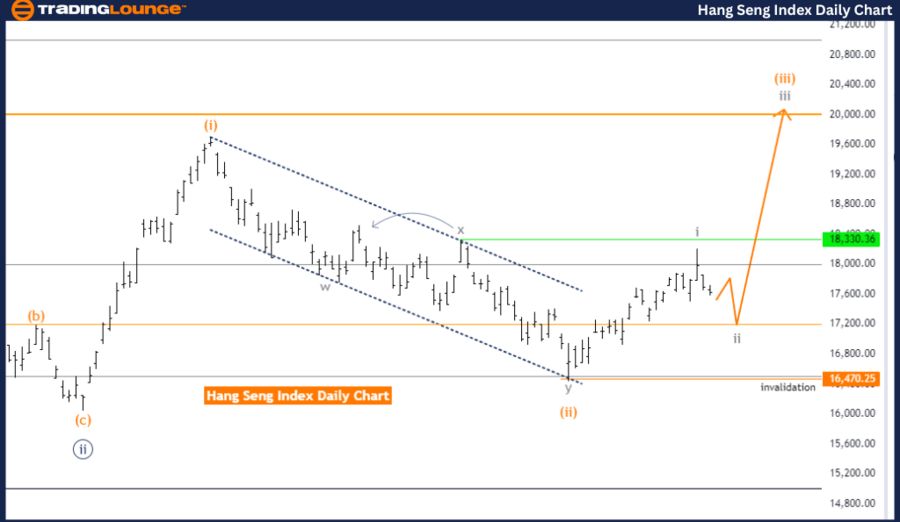
Hang Seng Index - Elliott Wave Analysis (Day Chart)
Hang Seng Elliott Wave Technical Analysis
FUNCTION: Counter Trend
MODE: Corrective
STRUCTURE: Gray Wave 2
POSITION: Orange Wave 3
DIRECTION NEXT HIGHER DEGREES: Gray Wave 3
DETAILS: Gray Wave 1 Completed, Gray Wave 2 Unfolding, Wave Cancel Invalidation Level: 16,470.25
The daily analysis of the Hang Seng Index, based on Elliott Wave principles, indicates that the market is currently in a counter-trend phase, characterized by corrective action. The ongoing formation is identified as Gray Wave 2, which follows the completion of Gray Wave 1. This transition suggests that the market has shifted from an impulsive phase in Gray Wave 1 to a corrective phase in Gray Wave 2.
With Gray Wave 1 completed, the initial impulsive movement has ended, and Gray Wave 2 is now active. This phase typically involves retracement or consolidation before the potential continuation of the next impulsive phase, Gray Wave 3. The positioning of Orange Wave 3 within this structure indicates that the current corrective movement is part of a larger trend.
The analysis suggests that once Gray Wave 2 concludes, the market is expected to resume its broader trend, with Gray Wave 3 anticipated to lead the next impulsive move upward. However, the market remains in a corrective state until Gray Wave 2 is fully formed. The wave cancel invalidation level is critical; if the index falls below 16,470.25, the current wave count would be invalidated, signaling a possible shift in market direction. As long as the index remains above this level, the market is considered to be in a corrective phase before resuming its upward trend.
Summary: The Hang Seng Index is in a corrective phase, with Gray Wave 2 currently unfolding after the completion of Gray Wave 1. The market is anticipated to resume its upward trajectory with Gray Wave 3, provided the index stays above the wave cancel invalidation level of 16,470.25.
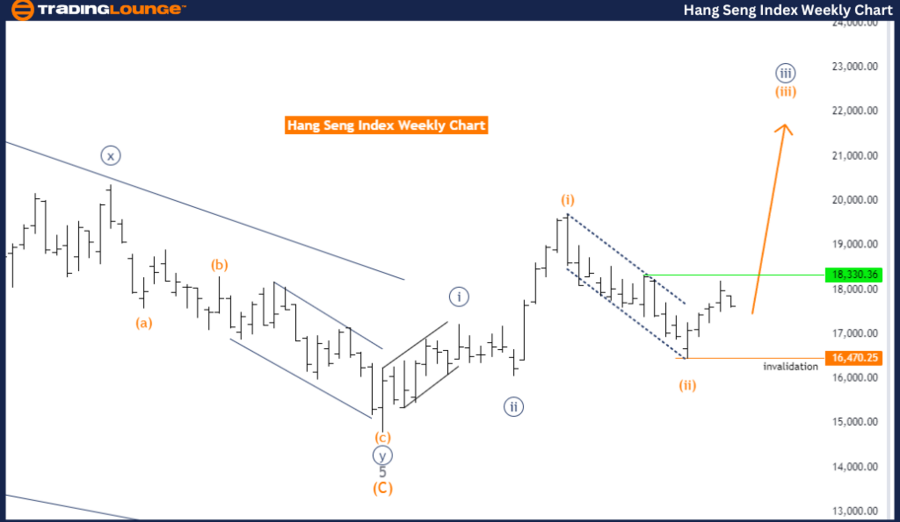
Hang Seng Index - Elliott Wave Analysis (Weekly Chart)
Hang Seng Elliott Wave Technical Analysis
FUNCTION: Bullish Trend
MODE: Impulsive
STRUCTURE: Orange Wave 3
POSITION: Navy Blue Wave 3
DIRECTION NEXT HIGHER DEGREES: Orange Wave 3 (Started)
DETAILS: Orange Wave 2 Completed, Orange Wave 3 in Progress, Wave Cancel Invalidation Level: 16,470.25
The weekly analysis of the Hang Seng Index, utilizing Elliott Wave theory, reveals that the market is in a bullish trend with an impulsive mode, indicating strong upward momentum. The current structure forming is Orange Wave 3, following the completion of Orange Wave 2.
The completion of Orange Wave 2 marks the transition from a corrective phase to an impulsive phase, signifying that the market is positioned to continue its upward trajectory with Orange Wave 3. The presence of Navy Blue Wave 3 within this structure further supports the ongoing bullish trend.
The analysis projects that the market will maintain its upward momentum, driven by the development of Orange Wave 3. The wave cancel invalidation level of 16,470.25 remains a critical threshold. As long as the index stays above this level, the current Elliott Wave count remains valid, suggesting continued bullish movement.
Summary: The Hang Seng Index weekly chart indicates a bullish trend, with Orange Wave 3 currently in progress following the completion of Orange Wave 2. The impulsive nature of this trend suggests further upward movement, supported by the presence of Navy Blue Wave 3. The wave cancel invalidation level of 16,470.25 is key; as long as the market stays above this level, the bullish outlook is expected to persist, with additional gains anticipated as Orange Wave 3 unfolds.
Technical Analyst: Malik Awais
Source: visit Tradinglounge.com and learn From the Experts Join TradingLounge Here
Previous: NASDAQ Elliott Wave Technical Analysis
Special Trial Offer - 0.76 Cents a Day for 3 Months! Click here
Access 7 Analysts Over 200 Markets Covered. Chat Room With Support