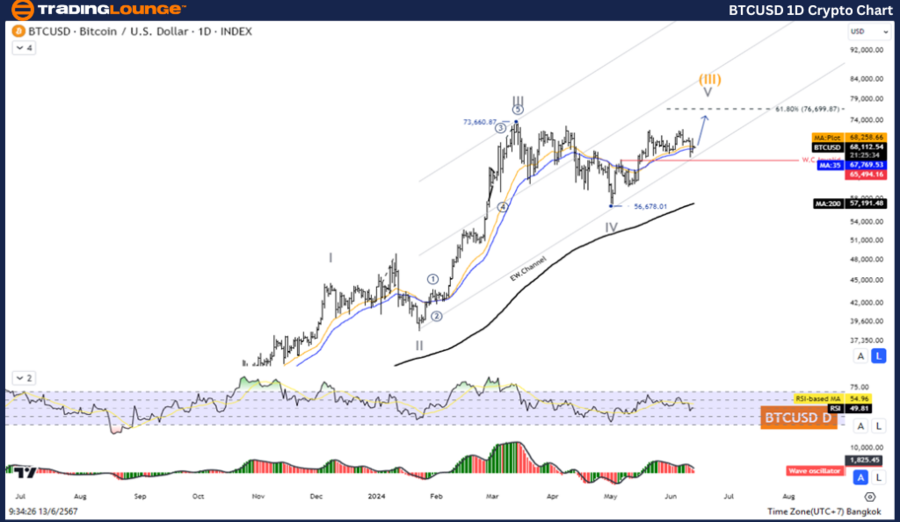
BTCUSD Elliott Wave Analysis TradingLounge Daily Chart

Bitcoin/ U.S. Dollar Currency Pair Analysis

BTCUSD Elliott Wave Technical Analysis

Function: Follow Trend

Mode: Motive

Structure: Impulse

Position: Wave V

Direction Next Higher Degrees: Wave (III)

Wave Cancel Invalid Level:

Details: The price is likely to increase above the level of 73,660.

Bitcoin/ U.S. Dollar (BTCUSD) Trading Strategy:

A five-wave increase in the Impulse pattern, with the fourth wave appearing to be complete. The price rose again during the fifth wave, leading to an overall increase above the level of 73,660.

Bitcoin/ U.S. Dollar (BTCUSD) Technical Indicators:

  • The price is below the MA200, indicating an uptrend.
  • The Wave Oscillator shows bullish momentum.

BTCUSD-1D-Crypto-Cha...


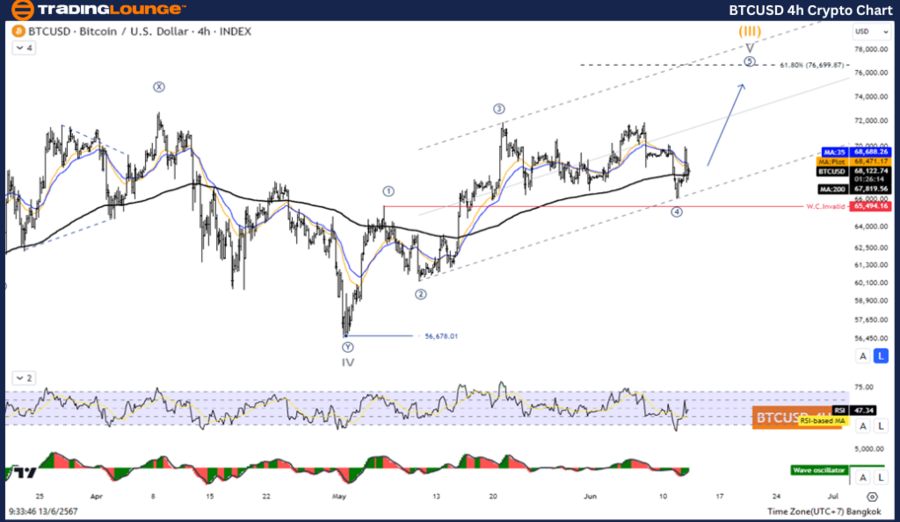
BTCUSD Elliott Wave Analysis TradingLounge H4 Chart

Bitcoin/ U.S. Dollar (BTCUSD) Chart Analysis

BTCUSD Elliott Wave Technical Analysis

Function: Follow Trend

Mode: Motive

Structure: Impulse

Position: Wave V

Direction Next Higher Degrees: Wave (III)

Wave Cancel Invalid Level:

Details: The price is likely to increase above the level of 73,660.

Bitcoin/ U.S. Dollar (BTCUSD) Trading Strategy:

A five-wave increase in the Impulse pattern, with the fourth wave appearing to be complete. The price rose again during the fifth wave, leading to an overall increase above the level of 73,660.

Bitcoin/ U.S. Dollar (BTCUSD) Technical Indicators:

  • The price is below the MA200, indicating an uptrend.
  • The Wave Oscillator shows bullish momentum.

Technical Analyst:  Kittiampon Somboonsod

Source: visit Tradinglounge.com and learn From the Experts Join TradingLounge Here 

See Previous: Monero (XMRUSD) Elliott Wave Technical Analysis

Special Trial Offer - 0.76 Cents a Day for 3 Months! Click here

Access 7 Analysts Over 170 Markets Covered. Chat Room With Support

BTCUSD-4h-Crypto-Cha...

Conclusion:

Our BTCUSD Elliott Wave analysis indicates that Bitcoin is positioned for a potential increase in price, supported by a complete fourth wave and bullish momentum indicated by the Wave Oscillator. Traders should consider this analysis for informed decision-making, as the price trend suggests an uptrend above 73,660. Staying updated with Elliott Wave patterns and technical indicators can provide significant advantages in cryptocurrency trading.

Related

DOW JONES - DJI Index Elliott Wave Technical Analysis: Understand how these waves impact Dow Jones trading strategies

DOW JONES - DJI Index Elliott Wave Technical Analysis: Understand how these waves impact Dow Jones trading strategies

This article provides a detailed Elliott Wave analysis for the Dow Jones (DJI) index, covering key m...

Read More >
NEO (NEOUSD) Crypto Price News Today Elliott Wave Technical Analysis: Triangle Wave C Analysis with Swing-Trade Setup

NEO (NEOUSD) Crypto Price News Today Elliott Wave Technical Analysis: Triangle Wave C Analysis with Swing-Trade Setup

An Elliott Wave breakdown of NEO/USD daily and 4-hour charts reveals a developing triangle pattern i...

Read More >
USDCHF Forex Elliott Wave Analysis: U.S. Dollar / Swiss Franc Currency Pair Technical Insights and Trading Strategies

USDCHF Forex Elliott Wave Analysis: U.S. Dollar / Swiss Franc Currency Pair Technical Insights and Trading Strategies

The USDCHF Elliott Wave analysis highlights bullish trends on daily and 4-hour charts. Orange wave 5...

Read More >
BAJAJ Finance Stock Analysis - BAJFINANCE Elliott Wave Technical Analysis for key Support and Resistance Levels

BAJAJ Finance Stock Analysis - BAJFINANCE Elliott Wave Technical Analysis for key Support and Resistance Levels

Explore a comprehensive BAJAJ Finance stock analysis using Elliott Wave theory. Understand potential...

Read More >
Bullish Outlook Confirmed: Elliott Wave Analysis Signals Uptrend for Major Global Indices

Bullish Outlook Confirmed: Elliott Wave Analysis Signals Uptrend for Major Global Indices

Index Analysis: S&P 500 (SPX): Action: Considering a long position at 5,850. Pattern: Observing...

Read More >
Fortinet Inc. (FTNT) Stocks Elliott Wave Technical Analysis: Covering Daily Chart and 1-hour Chart, Indicating a Bullish Trend

Fortinet Inc. (FTNT) Stocks Elliott Wave Technical Analysis: Covering Daily Chart and 1-hour Chart, Indicating a Bullish Trend

This article provides a detailed Elliott Wave analysis of Fortinet Inc. (FTNT), covering daily and 1...

Read More >

$1 for 2 Weeks

then $29 a month!

What a Special Offer!

Trade Recommendations

Unleash the power of deversified trading with our comprehensive portfolio, covering 250+ markets:

  • Stock Trades
  • Crypto Trades
  • Forex Trades
  • Commodity Trades
Elliott Wave Analysis

Gain a competitive edge with expert insights and AI-powered Elliott Wave charting into:

  • Global Indices
  • US Stocks & ASX Stocks
  • Forex & Crypto
  • Commodities
Top-Notch Trading Tools

Equip yourself with the tools of success:

  • Real-time Chat rooms
  • Elliott Wave Algorithm
  • Portfolio tools
  • TradingLevels
  • Screener
  • Trading Game
7 Elliott Wave Analysts

Stay ahead of the market with daily charts and insightful videos
Your secret to strategic trading!

JOIN HERE


Welcome to TradingLounge (ASIC A.R.No. 321187), specialists in trades, trading education and technical analysis, covering stocks, indices, commodities, forex and cryptocurrencies.

When you join TradingLounge you have access to everything we offer, including trade tools, educational content and a social platform to chat with like-minded investors.

Read more

@Copyright 2024 by tradinglounge.com

Contact Us

Australian no: 02 4787 6020

International no: +61 (2) 47876020

Pay with:

Find us on