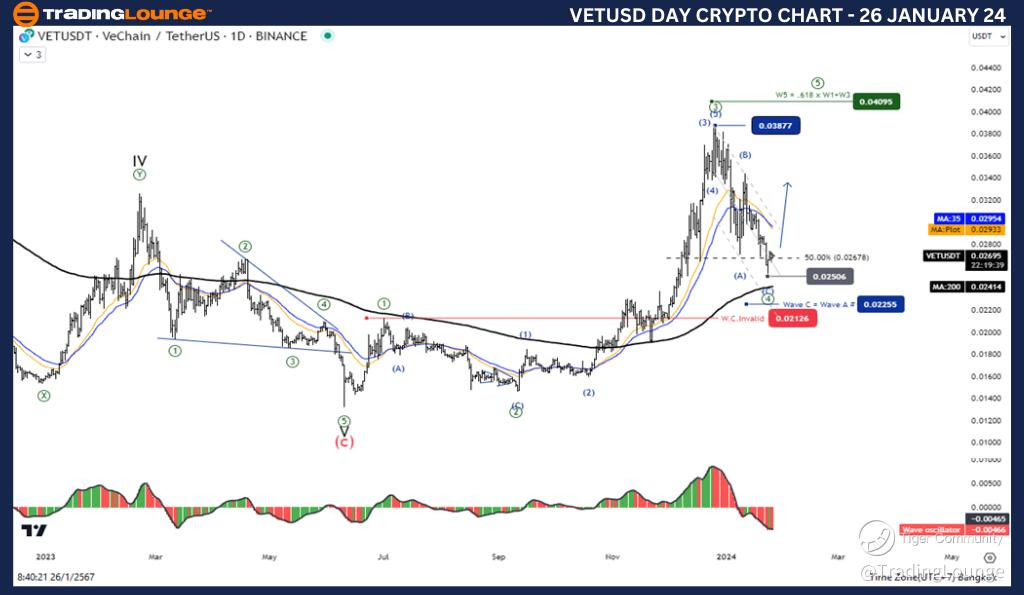
Elliott Wave Analysis TradingLounge Daily Chart, 26 January 24,
VeChain/U.S. dollar(VETUSD)
VETUSD Elliott Wave Technical Analysis
Function: Counter trend
Mode: Corrective
Structure: Zigzag
Position: Wave (A)
Direction Next higher Degrees: wave ((4)) of Impulse
Wave Cancel invalid Level: 0.2100
Details: Wave 4 Usually Throwback between 38.2-50% of wave 3
VeChain / U.S. dollar(VETUSD)Trading Strategy: We are looking for a green correction of wave ((4)) which will most likely retrace to 38.2% or 50% of wave ((3)) and a possible end of wave ((4)). Level 0.0250 The five-wave increase from the level 0.0250 supports this idea.
VeChain / U.S. dollar(VETUSD)Technical Indicators: The price is Above the MA200 indicating an uptrend, Wave Oscillators a bullish Momentum.
TradingLounge Analyst: Kittiampon Somboonsod, CEWA
Source: Tradinglounge.com get trial here!
Previous: DOTUSD
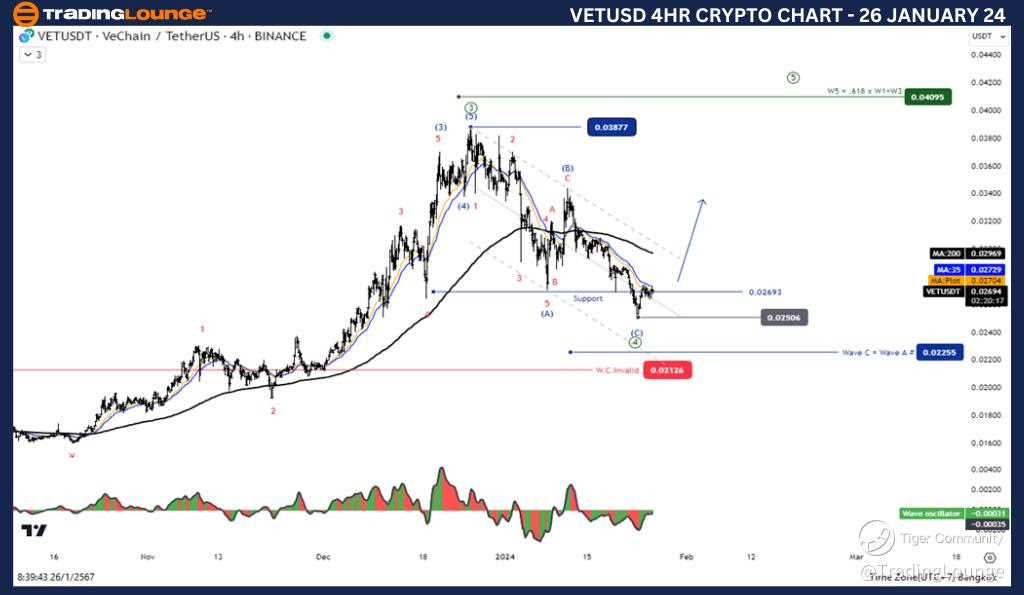
Elliott Wave Analysis TradingLounge 4H Chart, 26 January 24,
VeChain / U.S. dollar(VETUSD)
VETUSD Elliott Wave Technical Analysis
Function: Counter trend
Mode: Corrective
Structure: Zigzag
Position: Wave (A)
Direction Next higher Degrees: wave ((4)) of Impulse
Wave Cancel invalid Level: 0.2100
Details: the decline of wave A has a support at wave 4 Previous
VeChain / U.S. dollar(VETUSD) Trading Strategy: We are looking for a green correction of wave ((4)) which will most likely retrace to 38.2% or 50% of wave ((3)) and a possible end of wave ((4)). Level 0.0250 The five-wave increase from the level 0.0250 supports this idea..
VeChain / U.S. dollar(VETUSD)Technical Indicators: The price is below the MA200 indicating a downtrend, Wave Oscillators a bearish Momentum.