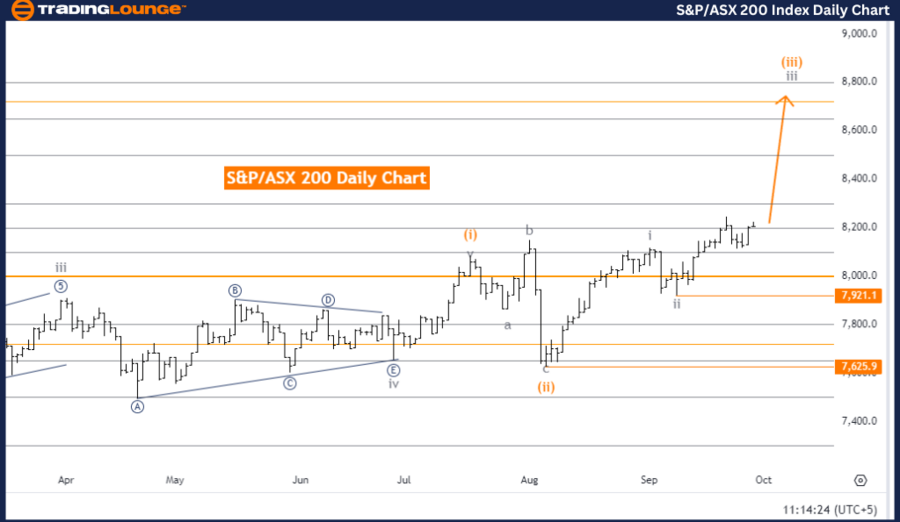
S&P/ASX 200 Elliott Wave Analysis - Trading Lounge Day Chart
S&P/ASX 200 Elliott Wave Technical Analysis
Function: Bullish Trend
Mode: Impulsive
Structure: Gray Wave 3
Position: Orange Wave 3
Direction (Next Lower Degrees): Gray Wave 4
Details: Gray Wave 2 appears complete. Now Gray Wave 3 of Orange Wave 3 is in progress. Wave cancel invalidation level: 7,921.1.
The S&P/ASX 200 Elliott Wave Analysis on the Day Chart indicates a bullish trend, suggesting the market is experiencing an upward movement. The current mode is impulsive, pointing to a strong and sustained move aligned with the overall trend.
The structure under analysis is Gray Wave 3, following the Elliott Wave Theory. The market is positioned in Orange Wave 3, which shows that the broader impulsive trend remains intact. The next expected phase would be Gray Wave 4, usually representing a corrective move after Gray Wave 3. However, Gray Wave 3 is still active, signifying the continued upward momentum of the market.
The previous phase, Gray Wave 2, is now complete, setting up Gray Wave 3 of Orange Wave 3. In Elliott Wave patterns, Wave 3 tends to be the strongest and longest, which means strong bullish momentum is pushing the market higher.
A key level to monitor is the invalidation level at 7,921.1. If the market dips below this, the current analysis would no longer hold, necessitating a re-evaluation of the wave structure. Holding above this point is critical to maintaining the bullish outlook.
Overall, the analysis suggests the bullish trend remains intact with continued upside potential, although traders should be cautious of the invalidation level. Gray Wave 3 is expected to complete before entering the corrective Gray Wave 4.
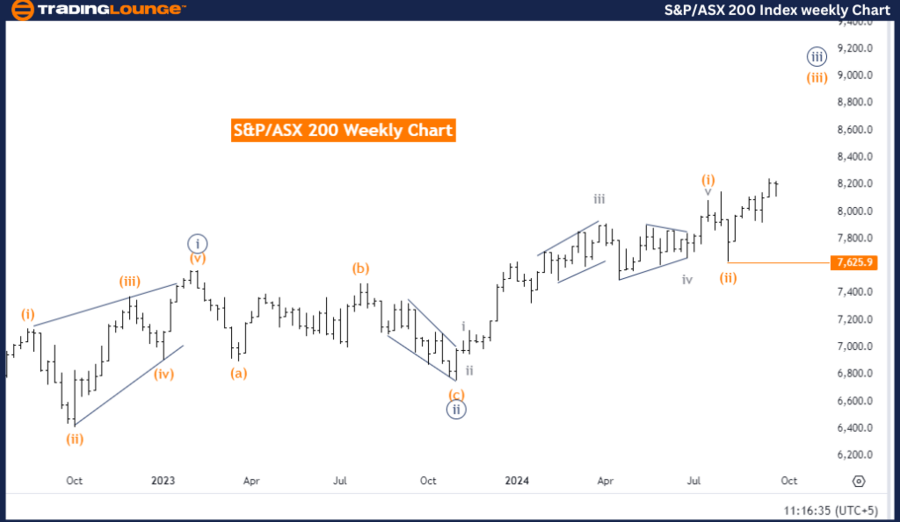
S&P/ASX 200 Elliott Wave Analysis - Trading Lounge Weekly Chart
S&P/ASX 200 Elliott Wave Technical Analysis
Function: Bullish Trend
Mode: Impulsive
Structure: Orange Wave 3
Position: Navy Blue Wave 3
Direction (Next Lower Degrees): Orange Wave 4
Details: Orange Wave 2 appears complete. Now Orange Wave 3 of 3 is in progress. Wave cancel invalidation level: 7,625.9.
The S&P/ASX 200 Elliott Wave Analysis on the Weekly Chart shows a bullish trend, signaling that the market continues to move higher. The trend mode is impulsive, indicating a strong and decisive market movement. The structure currently being analyzed is Orange Wave 3.
In the larger Elliott Wave framework, the market is in Navy Blue Wave 3, suggesting the bullish trend is persisting at a higher degree. Orange Wave 4 is the next anticipated phase, which typically introduces a corrective phase after the ongoing Orange Wave 3. However, as of now, Orange Wave 3 is still in progress, implying further upward potential before a correction begins.
The previous Orange Wave 2 is deemed complete, allowing Orange Wave 3 to continue. This wave is a pivotal part of the impulsive trend, reflecting ongoing bullish momentum in the market.
A critical invalidation level is set at 7,625.9. Should the market drop below this, the current wave analysis would no longer be valid, and a new wave count would need to be established. This level is key for traders, as staying above it maintains the bullish outlook.
In summary, the Elliott Wave analysis indicates a continuation of the bullish trend, with Wave 3 still evolving. Traders should keep a close watch on the 7,625.9 level, as any move below this would invalidate the current wave structure.
Technical Analyst: Malik Awais
Source: visit Tradinglounge.com and learn From the Experts Join TradingLounge Here
Previous: DAX 40 Index Elliott Wave Technical Analysis
VALUE Offer - Buy 1 Month & Get 3 Months!Click here
Access 7 Analysts Over 200 Markets Covered. Chat Room With Support