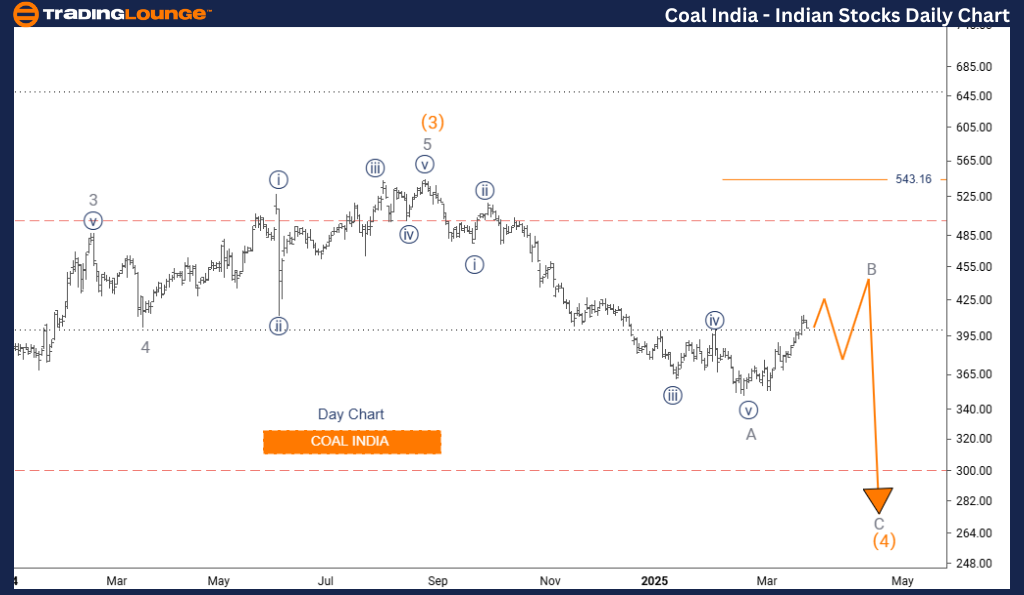
COAL INDIA – Elliott Wave Analysis | Trading Lounge Daily Chart

COAL INDIA Elliott Wave Technical Analysis

Function: Counter Trend

Mode: Corrective

Structure: Gray Wave B

Position: Orange Wave 4

Next Lower Degree Direction: Gray Wave C

Wave Cancel Invalid Level: 543.16

The Elliott Wave daily chart for COAL INDIA identifies a counter-trend correction currently underway. The price structure is unfolding within gray wave B, a retracement that follows the completed gray wave A decline. This activity sits within the broader orange wave 4 corrective structure.

Wave B typically represents a temporary reversal within a larger downward movement. As such, the ongoing bounce may be limited, with gray wave C anticipated to follow, pushing the stock lower. Critical resistance lies at 543.16—a break above this invalidates the current wave count and suggests a possible bullish shift.

The daily Elliott Wave outlook expects a continuation of the bearish structure following wave B, with wave C reinforcing the downtrend. Traders focused on short- to medium-term strategies may find potential shorting opportunities at the close of wave B.

Risk control remains key. A move above 543.16 will challenge the bearish setup. This technical analysis provides a structured method to interpret COAL INDIA stock price action, aiding decision-making within the Elliott Wave framework.

COAL-INDIA-indian-st...


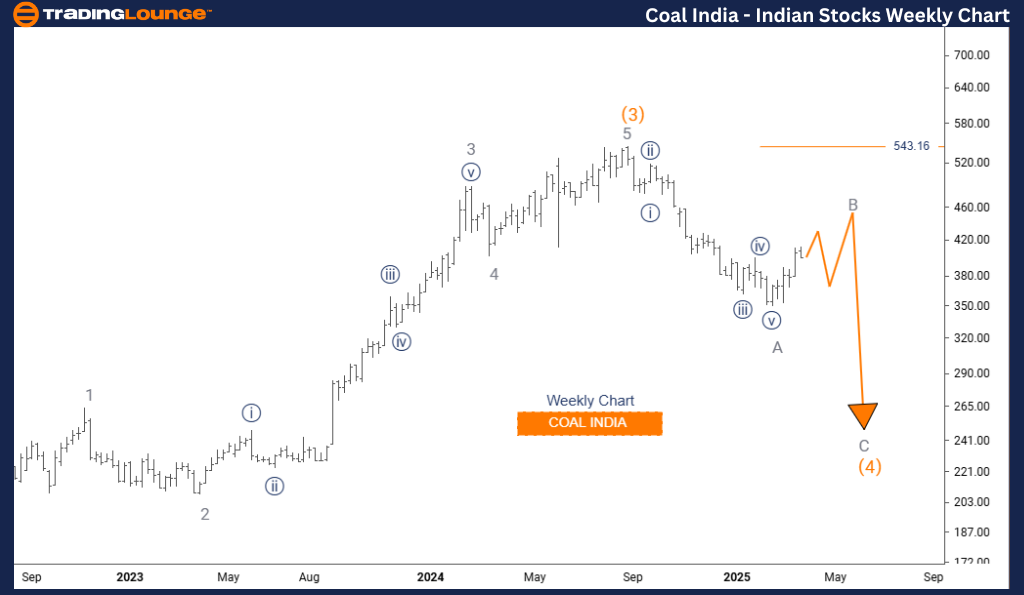
COAL INDIA – Elliott Wave Analysis | Trading Lounge Weekly Chart

COAL INDIA Elliott Wave Technical Analysis

Function: Counter Trend

Mode: Corrective

Structure: Gray Wave B

Position: Orange Wave 4

Next Lower Degree Direction: Gray Wave C

Wave Cancel Invalid Level: 543.16

The weekly chart Elliott Wave analysis for COAL INDIA presents a macro view of the stock's correction. It is currently developing within gray wave B, a retracement inside the broader orange wave 4 cycle. With gray wave A considered complete, the price appears to be navigating a temporary rally, common during corrective phases.

These patterns often produce sideways or moderate upward moves before the larger trend resumes. Key resistance at 543.16 serves as the invalidation point—surpassing this level would negate the current wave scenario and indicate a change in market sentiment.

Looking ahead, the chart anticipates a decline in gray wave C post-wave B. This scenario supports a bearish continuation in the long-term trend. Understanding this wave sequence helps traders align with the broader Elliott Wave cycle for COAL INDIA.

Corrective structures, like the one forming, usually follow identifiable three-wave or consolidation patterns. Monitoring such setups can offer timely trading insights, especially for managing existing positions or identifying new entries.

Maintaining disciplined risk levels near the invalidation zone is essential, especially if gray wave C confirms a renewed downtrend. This analysis serves as a strategic guide to assess market behavior within Elliott Wave principles.

Technical Analyst: Malik Awais

Source: visit Tradinglounge.com and learn From the Experts Join TradingLounge Here 

Previous: ADANI PORTS & SEZ Elliott Wave Technical Analysis

VALUE Offer - Buy 1 Month & Get 3 Months!Click here

Access 7 Analysts Over 200 Markets Covered. Chat Room With Support

COAL-INDIA-indian-st...

Related

Learn how to apply Elliott Wave theory to forecast NEO price and optimize your crypto trading strategy with NEOUSD Technical Analysis

Learn how to apply Elliott Wave theory to forecast NEO price and optimize your crypto trading strategy with NEOUSD Technical Analysis

This article offers a comprehensive Elliott Wave analysis of NEOUSD, providing insights into NEO pri...

Read More >
Learn about BXB Stock Trends, and What to Expect in Upcoming Sessions: Brambles Limited Elliott Wave Technical Forecast

Learn about BXB Stock Trends, and What to Expect in Upcoming Sessions: Brambles Limited Elliott Wave Technical Forecast

Our detailed Elliott Wave analysis on Brambles Limited (BXB) provides traders with key insights into...

Read More >
THETAUSD Elliott Wave Analysis: Technical Insights, Price Predictions and Key Wave Structures for Crypto Market Trends

THETAUSD Elliott Wave Analysis: Technical Insights, Price Predictions and Key Wave Structures for Crypto Market Trends

Elliott Wave analysis of THETA/USD covers short-term and long-term forecasts. Discover trading strat...

Read More >
S&P 500 Elliott Wave Analysis Reveals SPX Impulse Patterns, and Trading Strategies for Market Volatility Insights

S&P 500 Elliott Wave Analysis Reveals SPX Impulse Patterns, and Trading Strategies for Market Volatility Insights

S&P 500 Elliott Wave analysis from both daily and weekly perspectives. It highlights the current wav...

Read More >
Australian Dollar/U.S.Dollar (AUDUSD) Forex Elliott Wave Technical Analysis: In-depth Trading Lounge Chart Overview

Australian Dollar/U.S.Dollar (AUDUSD) Forex Elliott Wave Technical Analysis: In-depth Trading Lounge Chart Overview

This article provides an in-depth Elliott Wave analysis of the AUDUSD pair, featuring key insights i...

Read More >
U.S. Dollar / Japanese Yen (USDJPY) Elliott Wave Forecast: Daily & 4-Hour Bearish Trend Analysis, Wave 3 Formation

U.S. Dollar / Japanese Yen (USDJPY) Elliott Wave Forecast: Daily & 4-Hour Bearish Trend Analysis, Wave 3 Formation

USDJPY remains in a strong bearish trend according to Elliott Wave analysis, with active wave 3 form...

Read More >

$1 for 2 Weeks

then $29 a month!

What a Special Offer!

Trade Recommendations

Unleash the power of deversified trading with our comprehensive portfolio, covering 250+ markets:

  • Stock Trades
  • Crypto Trades
  • Forex Trades
  • Commodity Trades
Elliott Wave Analysis

Gain a competitive edge with expert insights and AI-powered Elliott Wave charting into:

  • Global Indices
  • US Stocks & ASX Stocks
  • Forex & Crypto
  • Commodities
Top-Notch Trading Tools

Equip yourself with the tools of success:

  • Real-time Chat rooms
  • Elliott Wave Algorithm
  • Portfolio tools
  • TradingLevels
  • Screener
  • Trading Game
7 Elliott Wave Analysts

Stay ahead of the market with daily charts and insightful videos
Your secret to strategic trading!

JOIN HERE


Welcome to TradingLounge (ASIC A.R.No. 321187), specialists in trades, trading education and technical analysis, covering stocks, indices, commodities, forex and cryptocurrencies.

When you join TradingLounge you have access to everything we offer, including trade tools, educational content and a social platform to chat with like-minded investors.

Read more

@Copyright 2024 by tradinglounge.com

Contact Us

Australian no: 02 4787 6020

International no: +61 (2) 47876020

Pay with:

Find us on