24Mar

Unlocking The CODE: ADANI PORTS - Indian Stocks With Elliott Wave Strategy, Stock Forecast, and Market Trend

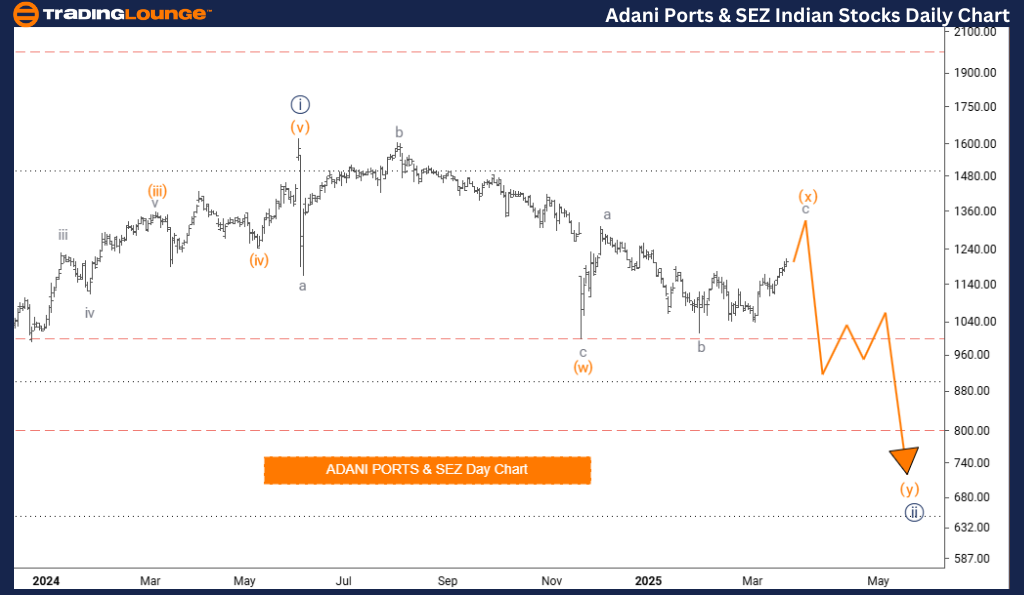
ADANI PORTS & SEZ Elliott Wave Analysis – TradingLounge Day Chart

ADANI PORTS & SEZ Technical Analysis Summary

FUNCTION: Counter-Trend

MODE: Corrective

STRUCTURE: Orange Wave X

POSITION: Navy Blue Wave 2

NEXT DIRECTION (Lower Degrees): Orange Wave Y

DETAILS:

Orange Wave W seems to have finished, and the formation of Orange Wave X is currently in motion.

This daily Elliott Wave analysis of ADANI PORTS & SEZ provides a clear interpretation of the stock’s current phase and its potential movement. The asset is in a counter-trend condition, suggesting a corrective price phase rather than a strong impulsive trend.

The analysis centers around Orange Wave X, forming part of the broader corrective structure under Navy Blue Wave 2. It appears that Orange Wave W has reached completion, and the market is progressing within Orange Wave X.

Since this is a corrective wave, traders can anticipate sideways or retracement patterns until a stronger directional trend resumes. Following this, the chart is likely to see the emergence of Orange Wave Y, the next step in the Elliott Wave cycle.

Key Takeaways:

  • Track the development of Orange Wave X closely.
  • Be alert for signs of the transition into Orange Wave Y.
  • Familiarity with wave structure improves accuracy in predicting market changes.

This Elliott Wave technical analysis for ADANI PORTS & SEZ’s daily chart delivers practical insights for short-term trading decisions. It helps traders align strategies with current corrective movements and enhances decision-making by identifying the wave phase.

ADANI-PORTS-daily-st...


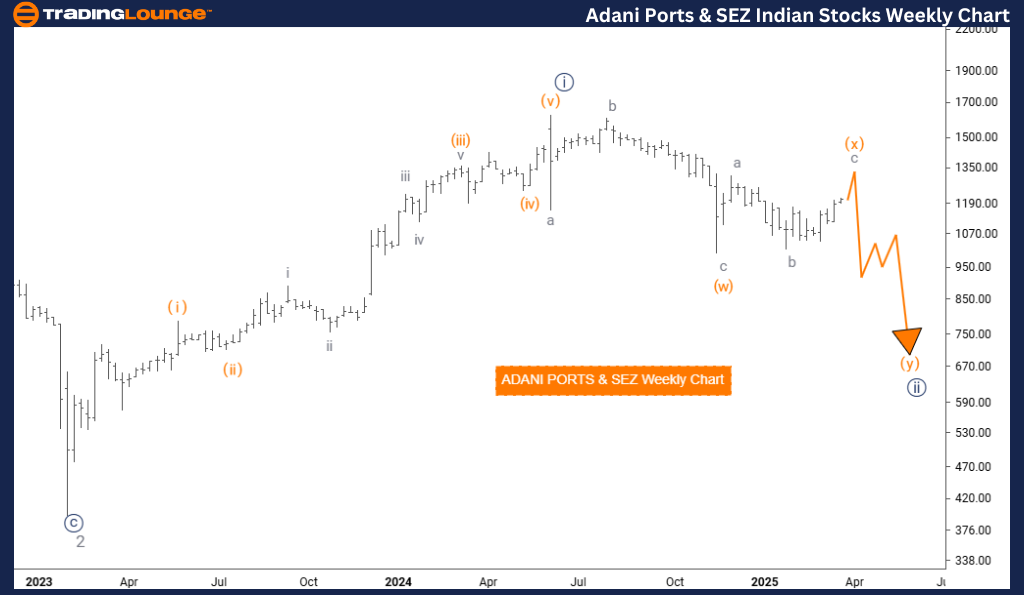
ADANI PORTS & SEZ Elliott Wave Analysis – TradingLounge Weekly Chart

ADANI PORTS & SEZ Technical Analysis Summary

FUNCTION: Counter-Trend

MODE: Corrective

STRUCTURE: Orange Wave X

POSITION: Navy Blue Wave 2

NEXT DIRECTION (Lower Degrees): Orange Wave Y

DETAILS:

Orange Wave W seems complete, with Orange Wave X now taking shape.

The weekly Elliott Wave analysis for ADANI PORTS & SEZ outlines the broader price movement and projected future trends. The stock remains in a corrective counter-trend phase, characterized by consolidation rather than impulsive moves.

Here, Orange Wave X is central, forming within the overarching structure of Navy Blue Wave 2. With Orange Wave W likely completed, the focus now shifts to the unfolding of Orange Wave X.

As a corrective wave, Orange Wave X may show sideways or pullback behavior before a fresh trend emerges. Upon its conclusion, Orange Wave Y is expected to follow in the sequence.

Key Takeaways:

  • Monitor Orange Wave X development on the weekly timeframe.
  • Get ready for a possible transition to Orange Wave Y.
  • Use wave theory for clearer forecasts and strategic trading.

This weekly chart analysis offers long-term trading insights into ADANI PORTS & SEZ, supporting traders in aligning with market structure and potential reversals. By identifying the current wave stage, traders can improve their strategy and respond confidently to shifting price dynamics.

Technical Analyst: Malik Awais

Source: visit Tradinglounge.com and learn From the Experts Join TradingLounge Here 

Previous:DR REDDY LABORATORIES Elliott Wave Technical Analysis

VALUE Offer - Buy 1 Month & Get 3 Months!Click here

Access 7 Analysts Over 200 Markets Covered. Chat Room With Support

ADANI-PORTS-weekly-s...

Related

Bitcoin/U.S. dollar(BTCUSD) Elliott Wave Technical Analysis 23 October 23

Bitcoin/U.S. dollar(BTCUSD) Elliott Wave Technical Analysis 23 October 23

Bitcoin/U.S. dollar(BTCUSD) Elliott Wave Technical Analysis on 23 October 23 with BTCUSD Analysis Da...

Read More >
Stay ahead of the Market with Our Expert XRP Chart Analysis and Price Predictions: XRPUSD Elliott Wave Technical Analysis

Stay ahead of the Market with Our Expert XRP Chart Analysis and Price Predictions: XRPUSD Elliott Wave Technical Analysis

Gain insights into XRP price movements with our in-depth Elliott Wave analysis. Discover trading str...

Read More >
Tech Stocks & Crypto: Elliott Wave Patterns and Forecasts

Tech Stocks & Crypto: Elliott Wave Patterns and Forecasts

A bullish move is forming after the current correction, signaled by the first Elliott Impulse wave a...

Read More >
XRPUSD Elliott Wave Technical Analysis: Insight into Crypto Price News

XRPUSD Elliott Wave Technical Analysis: Insight into Crypto Price News

Delve into the Elliott Wave analysis for XRPUSD, revealing both counter-trend and trend-following pe...

Read More >
Elliott Wave Technical Analysis and Stock Forecast for Dr Reddy's Laboratories: Key Insights and Price Targets

Elliott Wave Technical Analysis and Stock Forecast for Dr Reddy's Laboratories: Key Insights and Price Targets

Discover comprehensive Elliott Wave analysis and technical insights for Dr Reddy's Laboratories....

Read More >
Transurban Group (TCL) with our Elliott Wave analysis. Learn About Current Market Trends, Key Price Levels, and Trading Strategies

Transurban Group (TCL) with our Elliott Wave analysis. Learn About Current Market Trends, Key Price Levels, and Trading Strategies

Get detailed insights into ASX: Transurban Group (TCL) with our Elliott Wave analysis. Learn about c...

Read More >

$1 for 2 Weeks

then $29 a month!

What a Special Offer!

Trade Recommendations

Unleash the power of deversified trading with our comprehensive portfolio, covering 250+ markets:

  • Stock Trades
  • Crypto Trades
  • Forex Trades
  • Commodity Trades
Elliott Wave Analysis

Gain a competitive edge with expert insights and AI-powered Elliott Wave charting into:

  • Global Indices
  • US Stocks & ASX Stocks
  • Forex & Crypto
  • Commodities
Top-Notch Trading Tools

Equip yourself with the tools of success:

  • Real-time Chat rooms
  • Elliott Wave Algorithm
  • Portfolio tools
  • TradingLevels
  • Screener
  • Trading Game
7 Elliott Wave Analysts

Stay ahead of the market with daily charts and insightful videos
Your secret to strategic trading!

JOIN HERE


Welcome to TradingLounge (ASIC A.R.No. 321187), specialists in trades, trading education and technical analysis, covering stocks, indices, commodities, forex and cryptocurrencies.

When you join TradingLounge you have access to everything we offer, including trade tools, educational content and a social platform to chat with like-minded investors.

Read more

@Copyright 2024 by tradinglounge.com

Contact Us

Australian no: 02 4787 6020

International no: +61 (2) 47876020

Pay with:

Find us on