Cocoa Market Outlook: Elliott Wave Analysis and Future Price Movements

Cocoa Elliott Wave Analysis 

Function - Counter-trend
Mode - Corrective
Structure - Not yet defined
Position - Blue wave ‘a’
Direction - Blue wave ‘b’
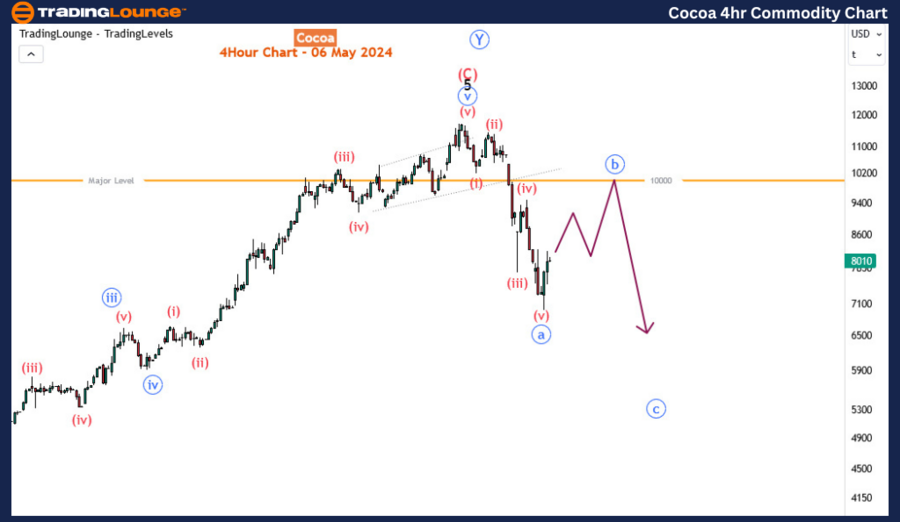
Details - Bearish impulse from the top appears to have completed the last leg. The current bounce for blue wave ‘b’ can extend toward the 10,000 key resistance.

Cocoa, after reaching an all-time high, has undergone a substantial decline, marking its most significant price drop since September 2022. This descent signals a pivotal shift in market sentiment, hinting at further downward movement in the ensuing weeks. However, amidst this bearish momentum, there exists the possibility of a temporary rebound, potentially leading to a retest of the crucial 10,000 major level. In this comprehensive analysis, we aim to delve into both the long-term and medium-term trajectory of this commodity.

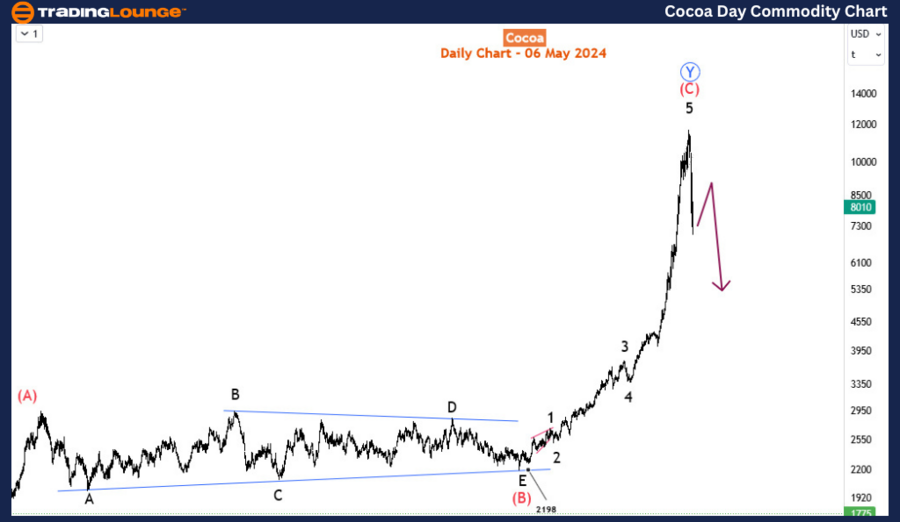
Daily Chart Analysis: Tracking Cocoa's Impressive Rally and Subsequent Decline

Examining the daily chart reveals a remarkable rally of over 420% from its September 2022 low of 2198 to achieve a fresh all-time high through an evident impulse wave. Before this surge, the price exhibited sideways movement for approximately six months. Presently, the ongoing decline from the peak appears to be forming the culmination of an impulse wave on the H4 charts. Consequently, we anticipate the emergence of either a continuation of this downward impulse or, at the very least, a corrective 3-wave pullback, potentially manifesting as a flat or zigzag pattern, with the latter being the more probable scenario.

Cocoa-DAY-Commodity-...


H4 Chart Insights: Detailed Examination of Cocoa's Recent Price Movements

On the H4 chart, the impulse from the all-time high seems to be nearing completion with wave (v). Alternatively, it's plausible that the current upward movement could be part of wave (v), suggesting that the impulse for blue wave ‘a’ may extend further downwards. Regardless, it is anticipated that following this impulse, a corrective bounce for blue wave ‘b’ will likely occur, possibly reaching the 10,000 mark or its vicinity, before the subsequent downward impulse unfolds.

The intensity of the third leg of this pattern will play a decisive role in determining whether a zigzag (blue wave ‘c’) or an impulse (blue wave ’3’) materializes from the peak. Should the third leg terminate at or before the 161.8% Fibonacci extension level, particularly around the 100% mark, the likelihood of a zigzag pattern increases. Conversely, if the extension surpasses the 161.8% threshold, the probability of an impulse wave strengthens. The latter scenario portends a deeper sell-off compared to the former, indicating the potential for a more pronounced downward movement in the market.

Technical Analyst: Sanmi Adeagbo

Source: visit Tradinglounge.com and learn From the Experts Join TradingLounge Here 

See Previous: Gold Elliott Wave Technical Analysis

Special Trial Offer - 0.76 Cents a Day for 3 Months! Click here

Access 6 Analysts covering over 150 Markets. Chat Room With Support

Cocoa-4H-Commodity-C...

Related

S&P/TSX 60 Elliott Wave Technical  Analysis: Market Trends, Corrective Wave Structure, Stock Forecast, Trading Strategy

S&P/TSX 60 Elliott Wave Technical Analysis: Market Trends, Corrective Wave Structure, Stock Forecast, Trading Strategy

Elliott Wave Analysis of the S&P/TSX 60 index, covering key aspects such as counter-trend movements,...

Read More >
Learn how to navigate Dogecoin Crypto Market Trends: DOGEUSD Elliott Wave Technical Analysis

Learn how to navigate Dogecoin Crypto Market Trends: DOGEUSD Elliott Wave Technical Analysis

This article thoroughly analyses Dogecoin (DOGEUSD) using Elliott Wave theory. It includes detailed ...

Read More >
Valuable insights: British Pound/ Australian Dollar (GBPAUD) Elliott Wave Technical Analysis

Valuable insights: British Pound/ Australian Dollar (GBPAUD) Elliott Wave Technical Analysis

The GBPAUD Elliott Wave Analysis for both the daily and 4-hour charts, underscores a counter-trend c...

Read More >
Unlocking ASX Trading Success: NEWMONT CORPORATION - NEM Stock Analysis & Elliott Wave Technical Forecast

Unlocking ASX Trading Success: NEWMONT CORPORATION - NEM Stock Analysis & Elliott Wave Technical Forecast

This article provides an in-depth Elliott Wave technical analysis for Newmont Corporation (NEM) list...

Read More >
Walmart Inc. (WMT) Elliott Wave Technical Analysis: Stock Price Prediction, Trend Forecast, and Market Insights for Investors

Walmart Inc. (WMT) Elliott Wave Technical Analysis: Stock Price Prediction, Trend Forecast, and Market Insights for Investors

Elliott Wave analysis of Walmart Inc. (WMT), covering both daily and 1-hour charts. The analysis hig...

Read More >
Swiss Market Index Elliott Wave Technical Analysis: Covering key Trading Strategies, Investment Insights, and Market Updates

Swiss Market Index Elliott Wave Technical Analysis: Covering key Trading Strategies, Investment Insights, and Market Updates

This comprehensive guide provides an in-depth Elliott Wave analysis of the Swiss Market Index (SMI ...

Read More >

$1 for 2 Weeks

then $29 a month!

What a Special Offer!

Trade Recommendations

Unleash the power of deversified trading with our comprehensive portfolio, covering 250+ markets:

  • Stock Trades
  • Crypto Trades
  • Forex Trades
  • Commodity Trades
Elliott Wave Analysis

Gain a competitive edge with expert insights and AI-powered Elliott Wave charting into:

  • Global Indices
  • US Stocks & ASX Stocks
  • Forex & Crypto
  • Commodities
Top-Notch Trading Tools

Equip yourself with the tools of success:

  • Real-time Chat rooms
  • Elliott Wave Algorithm
  • Portfolio tools
  • TradingLevels
  • Screener
  • Trading Game
7 Elliott Wave Analysts

Stay ahead of the market with daily charts and insightful videos
Your secret to strategic trading!

JOIN HERE


Welcome to TradingLounge (ASIC A.R.No. 321187), specialists in trades, trading education and technical analysis, covering stocks, indices, commodities, forex and cryptocurrencies.

When you join TradingLounge you have access to everything we offer, including trade tools, educational content and a social platform to chat with like-minded investors.

Read more

@Copyright 2024 by tradinglounge.com

Contact Us

Australian no: 02 4787 6020

International no: +61 (2) 47876020

Pay with:

Find us on