12Mar

TRXUSD Elliott Wave Analysis: Trading Strategy & Market Trends for Massive Gains – Is TRX Ready for a Bullish Breakout? Find Out Now!

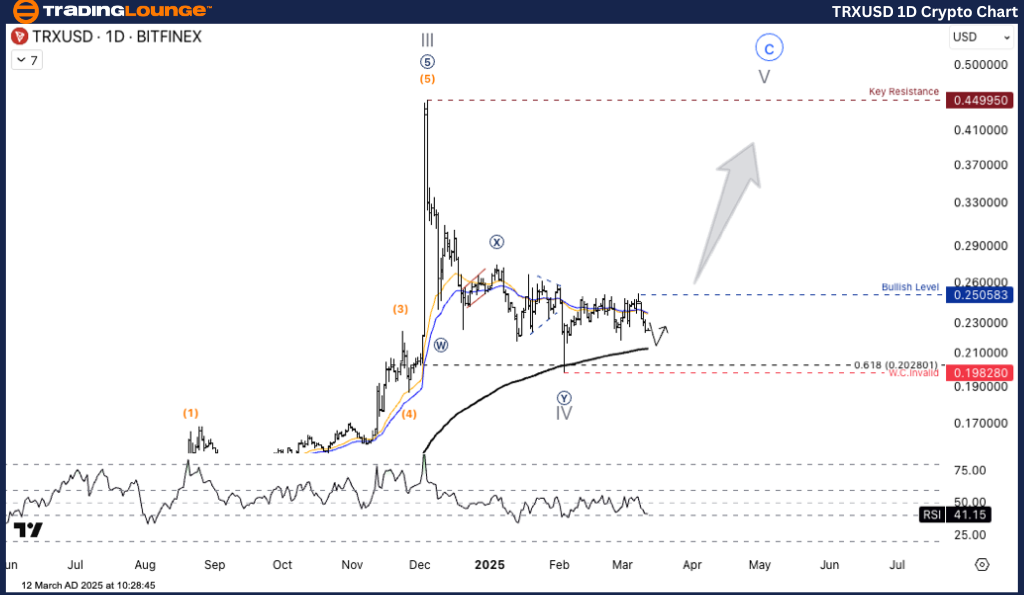
TRX/USD (TRXUSD) Elliott Wave Analysis - TradingLounge Daily Chart

TRXUSD Elliott Wave Technical Analysis

Function: Counter Trend

Mode: Corrective

Structure: Double Corrective

Position: Wave ((Y))

Next Higher Degree Direction: Wave IV of Impulse

Wave Cancellation Level: Not specified

Details: TRX/USD is currently navigating through Wave IV (Cycle Degree) after completing Wave III. If the price sustains above this level, there is a strong probability of initiating an uptrend in Wave V, potentially leading to bullish momentum.

TRX/USD (TRXUSD) Trading Strategy
The market remains within Wave IV (Cycle Degree) following the peak of Wave III. Presently, the price is consolidating, oscillating within Wave (X) or (Y). If the price sustains this support level, the potential for an uptrend towards Wave V remains high. However, a drop below $0.198 could indicate extended correction toward lower levels.

TRXUSD Trading Strategies

Long Strategy

Buy on price retracement to key support level (Pullback Entry).
Wait for a confirmed reversal signal at support before entering the trade.

🚨 Risk Management

The bullish wave structure is invalidated If the price falls below $0.198.

TRXUSD-1D-Crypto-Cha...


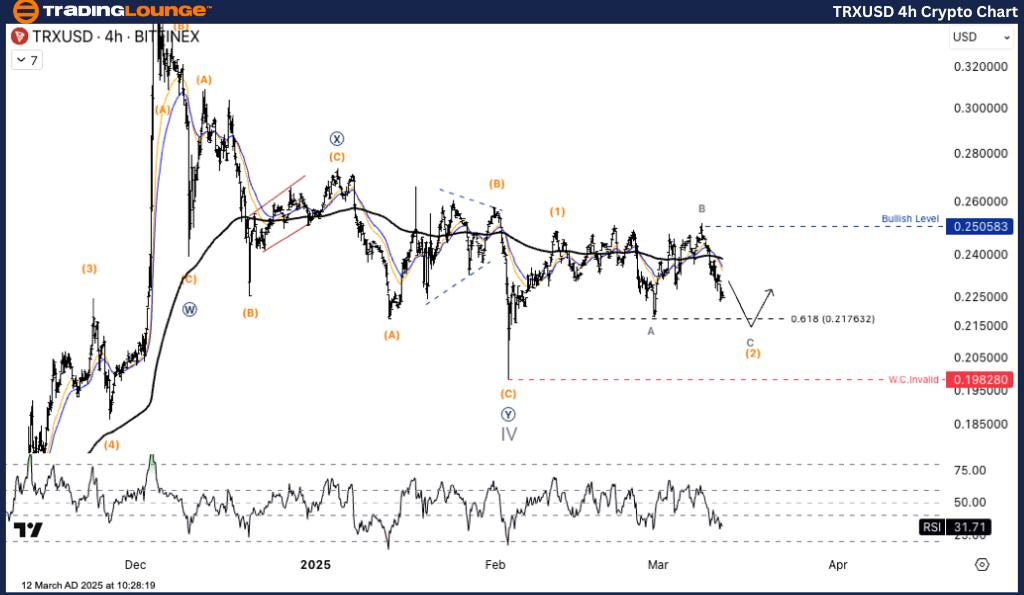
TRX/USD (TRXUSD) Elliott Wave Analysis - TradingLounge H4 Chart

TRXUSD Elliott Wave Technical Analysis

Function: Counter Trend

Mode: Corrective

Structure: Flat

Position: Wave C

Next Higher Degree Direction: Wave (2) of Impulse

Wave Cancellation Level: Not specified

Details: TRX/USD is currently positioned within a potential reversal zone, aligning with the Wave (3) structure. This zone may provide a bullish setup if key support levels hold.

TRX/USD (TRXUSD) Trading Strategy
The price is in Wave (2), forming an ABC corrective pattern. The Fibonacci 0.618 level ($0.2176) serves as a critical support zone. If the price remains above this level, an uptrend towards Wave (3) is likely.

TRX/USD Trading Strategies

Long Strategy

Buy when the price dips to the key support level (Pullback Entry).
Wait for a confirmation signal of reversal at the support before entering.

🚨 Risk Management

If the price falls below $0.198, the bullish structure is invalidated.

Technical Analyst: Kittiampon Somboonsod

Source: Visit Tradinglounge.com and learn from the Experts. Join TradingLounge Here 

Previous: BTCUSD Elliott Wave Technical Analysis

VALUE Offer - Buy 1 Month & Get 3 Months!Click here

Access 7 Analysts Over 200 Markets Covered. Chat Room With Support

TRXUSD-4h-Crypto-Cha...

Related

Unlocking ASX Trading Success: COCHLEAR LIMITED - COH Stock Analysis & Elliott Wave Technical Forecast

Unlocking ASX Trading Success: COCHLEAR LIMITED - COH Stock Analysis & Elliott Wave Technical Forecast

COCHLEAR LIMITED (COH) stock on the Australian Stock Exchange (ASX) using Elliott Wave theory, provi...

Read More >
Elliott WaveTechnical Analysis of Iron Ore Market: SGX TSI Index Insights, Price Trends, Technical Forecasts, and Key Market Dynamics

Elliott WaveTechnical Analysis of Iron Ore Market: SGX TSI Index Insights, Price Trends, Technical Forecasts, and Key Market Dynamics

This article offers a comprehensive Elliott Wave analysis of the iron ore market, focusing on price ...

Read More >
NEE Elliott Wave Analysis: Explore NextEra Energy Stock Trends, Flat Structures, and Bullish Reversal Forecasts

NEE Elliott Wave Analysis: Explore NextEra Energy Stock Trends, Flat Structures, and Bullish Reversal Forecasts

Elliott Wave analysis of NextEra Energy (NEE) examines current stock trends, focusing on wave C corr...

Read More >
NVIDIA Corp. (NVDA) Stocks Elliott Wave Technical Analysis Includes NVDA's Wave Counts, Potential Targets, and Resistance Levels

NVIDIA Corp. (NVDA) Stocks Elliott Wave Technical Analysis Includes NVDA's Wave Counts, Potential Targets, and Resistance Levels

This article offers a comprehensive analysis of NVIDIA Corp. (NVDA) using Elliott Wave Theory. We de...

Read More >
Elliott Wave Technical Analysis and Stock Forecast for Dr Reddy's Laboratories: Key Insights and Price Targets

Elliott Wave Technical Analysis and Stock Forecast for Dr Reddy's Laboratories: Key Insights and Price Targets

Discover comprehensive Elliott Wave analysis and technical insights for Dr Reddy's Laboratories....

Read More >
WTI Crude Oil Commodity Elliott Wave Technical Analysis: Crude Oil is Experiencing a Recovery

WTI Crude Oil Commodity Elliott Wave Technical Analysis: Crude Oil is Experiencing a Recovery

In this analysis, we provide a detailed Elliott Wave forecast for WTI and crude oil prices in June 2...

Read More >

Buy 1 Month

Get 3 Months!

Special Offer:

Trade Recommendations

Unleash the power of deversified trading with our comprehensive portfolio, covering:

  • Stock Trades
  • Crypto Trades
  • Forex Trades
  • Commodity Trades
Elliott Wave Analysis

Gain a competive edge with expert insights in to:

  • Global Indices
  • US Stocks & ASX Stocks
  • Forex & Crypto
  • Commodities
Top-Notch Trading Tools

Equip yourself with the tools of success:

  • Social Chat
  • Elliott Wave Algorithm
  • Screener
  • TradingLevels
  • Trading Game
7 Elliott Wave Analysts

Stay ahead of the market with daily charts and insightful videos
-Your secret to strategic trading!

JOIN HERE


Welcome to TradingLounge (ASIC A.R.No. 321187), specialists in trades, trading education and technical analysis, covering stocks, indices, commodities, forex and cryptocurrencies.

When you join TradingLounge you have access to everything we offer, including trade tools, educational content and a social platform to chat with like-minded investors.

Read more

@Copyright 2024 by tradinglounge.com

Contact Us

Australian no: 02 4787 6020

International no: +61 (2) 47876020

Pay with:

Find us on