15Jul

GBPAUD Elliott Wave Forecast and Technical Chart Analysis for Daily and 4-Hour Timeframes in British Pound to Australian Dollar Market

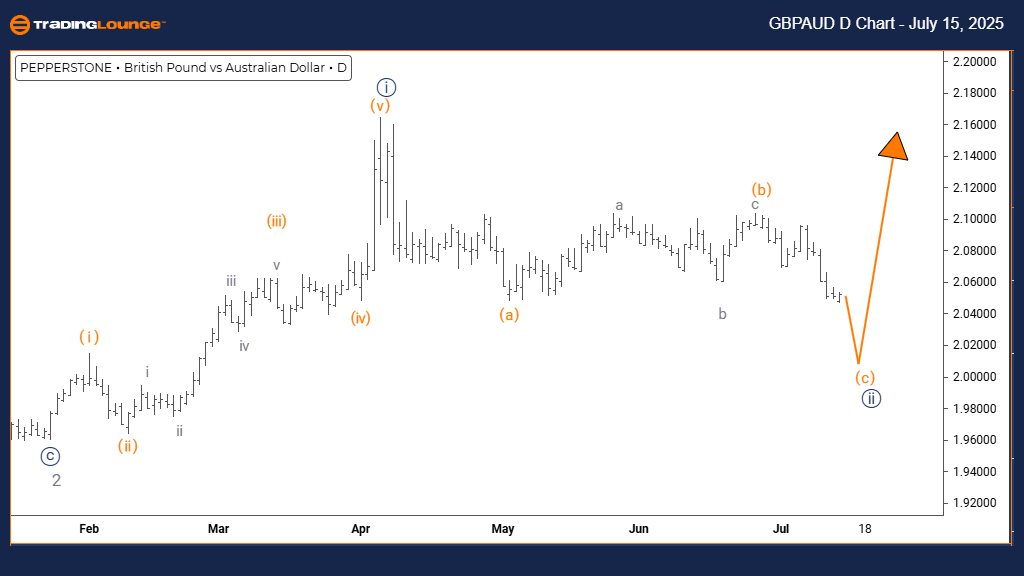
British Pound / Australian Dollar (GBPAUD) Elliott Wave Analysis - TradingLounge  Daily Chart

GBPAUD Elliott Wave Forecast

Function: Counter-Trend

Mode: Corrective

Structure: Navy Blue Wave 2

Position: Gray Wave 3

Direction Next Higher Degrees: Navy Blue Wave 3

Details: Completion of Navy Blue Wave 1 confirmed; development of Navy Blue Wave 2 underway.

The daily GBPAUD Elliott Wave analysis indicates a corrective counter-trend phase within a broader bullish structure. Currently, Navy Blue Wave 2 is unfolding inside Gray Wave 3, suggesting a temporary pullback before the larger uptrend continues.

Following the completion of Navy Blue Wave 1, market behavior transitioned into Navy Blue Wave 2, typically representing retracement or sideways consolidation. As a corrective wave, it generally shows less momentum and weaker directionality compared to impulsive moves.

Traders are advised to watch for completion signals in Navy Blue Wave 2. Once it finalizes, the chart structure suggests the emergence of Navy Blue Wave 3, which often carries strong upward momentum. With the price still operating within Gray Wave 3, the overall bullish outlook remains intact.

This daily timeframe analysis offers traders strategic insight into the current phase of the GBPAUD market cycle and helps prepare for the next impulsive wave sequence.

GBPAUD-D-FOREX-CHART...


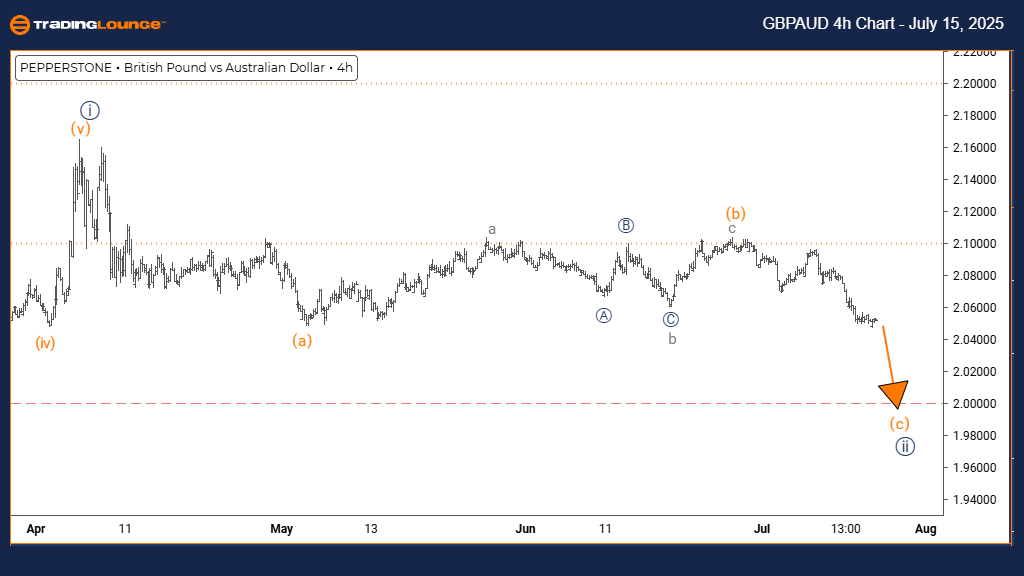
British Pound / Australian Dollar (GBPAUD) Elliott Wave Analysis – TradingLounge 4H Chart

GBPAUD Elliott Wave Forecast

Function: Counter-Trend

Mode: Impulsive

Structure: Orange Wave C

Position: Navy Blue Wave 2

Direction Next Lower Degrees: Orange Wave C (In Progress)

Details: Orange Wave B completed; Orange Wave C currently developing.

The 4-hour GBPAUD Elliott Wave outlook shows a short-term impulsive phase forming Orange Wave C inside the broader Navy Blue Wave 2 correction. This reflects downward movement in the context of a larger upward trend.

After the end of Orange Wave B, the chart now indicates the progression of Orange Wave C, the final leg in the corrective sequence. This wave typically brings deeper retracement with increased volatility and strong short-term bearish momentum.

As part of the corrective structure, Orange Wave C plays a crucial role in shaping the end of Navy Blue Wave 2. Traders should monitor key support zones and look for reversal signals. Once completed, upward continuation is expected with the start of a new impulsive wave.

This analysis equips traders with clear insights to anticipate potential trend reversals and manage trades around the completion of the current correction.

Technical Analyst: Malik Awais

Source: Visit Tradinglounge.com and learn from the Experts. Join TradingLounge Here

Previous: EURUSD Elliott Wave Technical Analysis

VALUE Offer - Buy 1 Month & Get 3 Months!Click here

Access 7 Analysts Over 200 Markets Covered. Chat Room With Support

GBPAUD-4H-FOREX-CHAR...

Related

WIPRO Stocks Elliott Wave Technical Analysis: Learn How Wave Counts and Projections Can Guide Your Trading Decisions

WIPRO Stocks Elliott Wave Technical Analysis: Learn How Wave Counts and Projections Can Guide Your Trading Decisions

This article dives into the Elliott Wave analysis of Wipro, providing a comprehensive breakdown of i...

Read More >
U.S. Dollar/Canadian Dollar (USDCAD) Forex Elliott Wave Technical Analysis: Risk management and technical analysis for Forex trading

U.S. Dollar/Canadian Dollar (USDCAD) Forex Elliott Wave Technical Analysis: Risk management and technical analysis for Forex trading

Get detailed USD/CAD Elliott Wave analysis for both daily and 4-hour charts. Learn about counter-tre...

Read More >
Eli Lilly & Co., (LLY) Elliott Wave Technical Analysis 31 January 24

Eli Lilly & Co., (LLY) Elliott Wave Technical Analysis 31 January 24

Trading Lounge Day and 4Hr Chart for Eli Lilly & Co., (LLY) Elliott Wave Technical Analysis dated 31...

Read More >
Learn Effective S&P 500 Trading Strategies and Discover the Best Stocks to Buy: S&P 500 Index Elliott Wave Technical Analysis

Learn Effective S&P 500 Trading Strategies and Discover the Best Stocks to Buy: S&P 500 Index Elliott Wave Technical Analysis

Our in-depth S&P 500 Elliott Wave Analysis offers a detailed view of the current market trends, prov...

Read More >
NEO Crypto Price: Key Technical Indicators to enhance your trading decisions: NEOUSD Elliott Wave Technical Analysis

NEO Crypto Price: Key Technical Indicators to enhance your trading decisions: NEOUSD Elliott Wave Technical Analysis

Explore comprehensive Elliott Wave analysis for NEO/USD, including daily and H4 chart insights, corr...

Read More >
GX Uranium ETF Elliott Wave Technical Analysis: Price Prediction, and Investment Opportunities in the Uranium Sector

GX Uranium ETF Elliott Wave Technical Analysis: Price Prediction, and Investment Opportunities in the Uranium Sector

GX Uranium ETF with the detailed Elliott Wave analysis. Understand key support levels, market trends...

Read More >

$1 for 2 Weeks

then $29 a month!

What a Special Offer!

Trade Recommendations

Unleash the power of deversified trading with our comprehensive portfolio, covering 250+ markets:

  • Stock Trades
  • Crypto Trades
  • Forex Trades
  • Commodity Trades
Elliott Wave Analysis

Gain a competitive edge with expert insights and AI-powered Elliott Wave charting into:

  • Global Indices
  • US Stocks & ASX Stocks
  • Forex & Crypto
  • Commodities
Top-Notch Trading Tools

Equip yourself with the tools of success:

  • Real-time Chat rooms
  • Elliott Wave Algorithm
  • Portfolio tools
  • TradingLevels
  • Screener
  • Trading Game
7 Elliott Wave Analysts

Stay ahead of the market with daily charts and insightful videos
Your secret to strategic trading!

JOIN HERE


Welcome to TradingLounge (ASIC A.R.No. 321187), specialists in trades, trading education and technical analysis, covering stocks, indices, commodities, forex and cryptocurrencies.

When you join TradingLounge you have access to everything we offer, including trade tools, educational content and a social platform to chat with like-minded investors.

Read more

@Copyright 2024 by tradinglounge.com

Contact Us

Australian no: 02 4787 6020

International no: +61 (2) 47876020

Pay with:

Find us on