14Jul

EURUSD Elliott Wave Overview: Daily Wave 3 Upside and 4H Micro Wave 2 Pullback Signals Resumption with Fibonacci Entry Opportunities

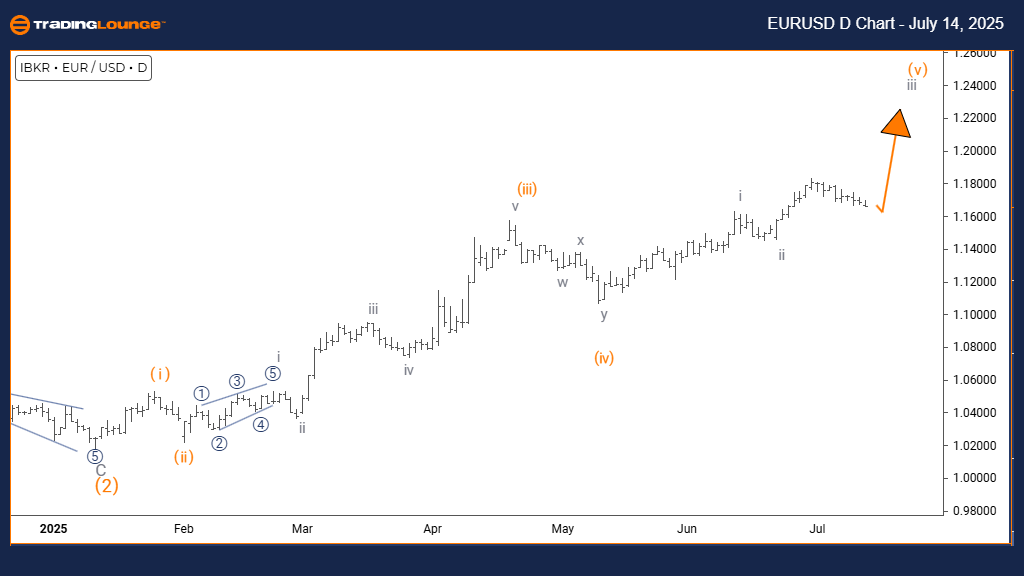
Euro/U.S. Dollar (EURUSD) Elliott Wave Analysis - TradingLounge  Daily Chart

EURUSD Daily Chart Analysis

EURUSD Elliott Wave Technical Analysis

Function: Trend

Mode: Impulsive

Structure: Gray Wave 3

Position: Orange Wave 5

Direction (Next Higher Degrees): Gray Wave 3 Initiated

Details: Gray wave 2 looks complete; gray wave 3 is actively progressing.

The daily EURUSD chart confirms a bullish Elliott Wave structure, highlighting an impulsive trend in motion. The pair currently advances through gray wave 3, positioned inside orange wave 5—an indication of the latter stages of the present impulsive leg.

Completion of gray wave 2 has triggered the beginning of gray wave 3, a phase known for strong upward momentum and clear bullish pressure. The market shows a sequence of higher highs and higher lows, validating the impulsive wave setup.

The presence of orange wave 5 inside gray wave 3 suggests this could be the final push in the intermediate rally. However, as gray wave 3 unfolds at a higher degree, EURUSD likely has more room to rise. Traders should closely track wave extensions and Fibonacci targets—both common markers during wave 3 surges.

EURUSD-Forex-D-chart...


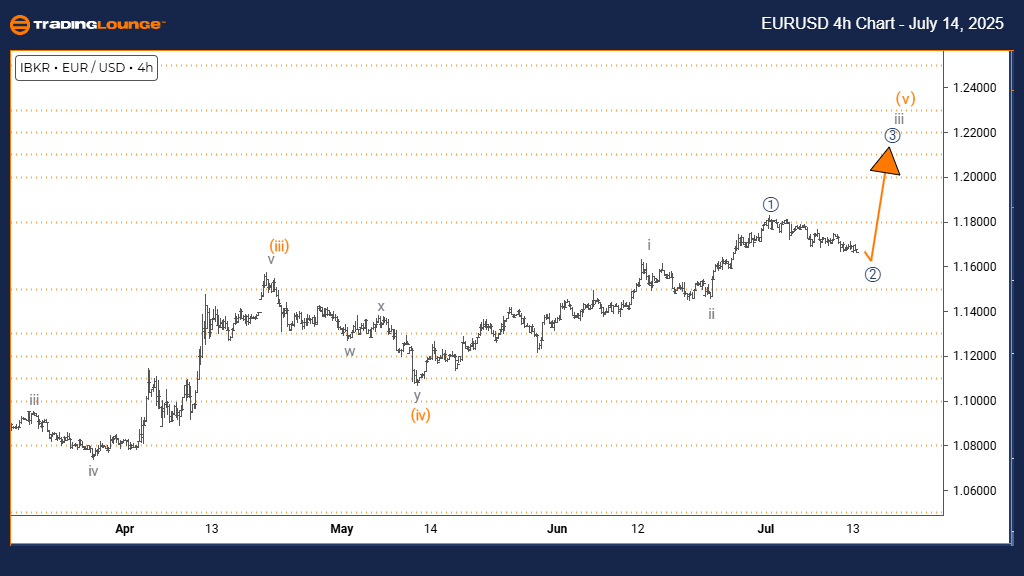
EURUSD Elliott Wave Analysis – TradingLounge 4H Chart

Function: Counter Trend

Mode: Corrective

Structure: Micro Navy Blue Wave 2

Position: Within Gray Wave 3

Direction (Next Higher Degrees): Micro Navy Blue Wave 3 Approaching

Details: Micro navy blue wave 1 is confirmed; micro navy blue wave 2 is developing.

The 4-hour EURUSD chart indicates a short-term corrective phase, unfolding as micro navy blue wave 2 inside the broader bullish gray wave 3 trend. This movement reflects a temporary counter-trend pullback.

Micro wave 1 has finished, and the current activity in wave 2 lacks strong directional momentum. This typically leads to sideways or limited retracements, often observed during corrective phases. Once this correction concludes, micro wave 3 should initiate, aligning with the main bullish structure.

Traders should monitor for stabilization signs, reversal candles, or wave completion setups. Since EURUSD remains inside the powerful gray wave 3, any pullback is expected to be short-lived and may offer entry opportunities aligned with the primary trend.

Technical Analyst: Malik Awais

Source: Visit Tradinglounge.com and learn from the Experts. Join TradingLounge Here

Previous: AUDUSD Elliott Wave Technical Analysis

VALUE Offer - $1 for 2 Weeks then $29 a month!Click here

Access 7 Analysts Over 200 Markets Covered. Chat Room With Support

EURUSD-Forex-4h-char...

Related

What is Bitcoin Hash Rate ?

What is Bitcoin Hash Rate ?

The Bitcoin hash rate measures the total computational power used by miners to process transactions ...

Read More >
Northern Star Resources ASX: NST Stock Analysis & Elliott Wave Technical Forecast Predicts Bearish Move With Price Target

Northern Star Resources ASX: NST Stock Analysis & Elliott Wave Technical Forecast Predicts Bearish Move With Price Target

Elliott Wave analysis of ASX:NST shows a bearish impulse forming Wave C of Wave 4, with a short-term...

Read More >
Unlocking Potential Gains: META Platforms Inc. (META) Elliott Wave Technical Analysis offering actionable insights

Unlocking Potential Gains: META Platforms Inc. (META) Elliott Wave Technical Analysis offering actionable insights

Elliott Wave Analysis for META Platforms Inc. (META) dated February 16, 2024, offering actionable in...

Read More >
ADANI PORTS & SEZ - ADANIPORT Elliott Wave Forecast Shows Bullish Trend With Key 1040 Support

ADANI PORTS & SEZ - ADANIPORT Elliott Wave Forecast Shows Bullish Trend With Key 1040 Support

Elliott Wave analysis of Adani Ports & SEZ reveals a bullish impulsive trend with upward potential a...

Read More >
BHP GROUP LIMITED - BHP Elliott Wave Analysis: Forecasts Bullish Wave 3 After Zigzag Correction With Price Targets

BHP GROUP LIMITED - BHP Elliott Wave Analysis: Forecasts Bullish Wave 3 After Zigzag Correction With Price Targets

This Elliott Wave analysis for ASX: BHP highlights the completion of wave 2 and the potential format...

Read More >

$1 for 2 Weeks

then $29 a month!

What a Special Offer!

Trade Recommendations

Unleash the power of deversified trading with our comprehensive portfolio, covering 250+ markets:

  • Stock Trades
  • Crypto Trades
  • Forex Trades
  • Commodity Trades
Elliott Wave Analysis

Gain a competitive edge with expert insights and AI-powered Elliott Wave charting into:

  • Global Indices
  • US Stocks & ASX Stocks
  • Forex & Crypto
  • Commodities
Top-Notch Trading Tools

Equip yourself with the tools of success:

  • Real-time Chat rooms
  • Elliott Wave Algorithm
  • Portfolio tools
  • TradingLevels
  • Screener
  • Trading Game
7 Elliott Wave Analysts

Stay ahead of the market with daily charts and insightful videos
Your secret to strategic trading!

JOIN HERE


Welcome to TradingLounge (ASIC A.R.No. 321187), specialists in trades, trading education and technical analysis, covering stocks, indices, commodities, forex and cryptocurrencies.

When you join TradingLounge you have access to everything we offer, including trade tools, educational content and a social platform to chat with like-minded investors.

Read more

@Copyright 2024 by tradinglounge.com

Contact Us

Australian no: 02 4787 6020

International no: +61 (2) 47876020

Pay with:

Find us on